Sky Blog
With Say on Pay (“SOP”) now entrenched in the psyche of compensation committees along with Institutional Shareholder Services’ (“ISS”) evolving standards, improving disclosure of short- and long-term incentive (“STIP” and “LTIP”, respectively) plans, including measures used, the values associated with those measures, and how they can be expected to drive performance, should continue to be a priority for all public companies.
In order to review incentive trends (particularly, the underlying incentive design), Arthur J. Gallagher & Co.’s Human Resources & Compensation Consulting Practice has conducted a study of 2013 compensation data as disclosed in 2014 annual proxy statements for 200 of the largest U.S. companies, entitled the “Study of 2013 Short- and Long-Term Incentive Design Criterion Among Top 200 S&P 500 Companies.”
This is the sixth year that the study has been conducted for the top 200 public companies. The full study can be viewed on the company’s website, at http://www.ajg.com/knowledge-center/whitepapers/study-of-2013-short-and-long-term-incentive-design-among-top-200-sp-500-companies/.
Some highlights are as follows:
UMBRELLA PLANS
Of the 200 companies reviewed, 59% of companies with STIPs indicated the use of “umbrella” STIP plans (also referred to as “inside/outside” plans), up from 57% in 2012, 50% in 2011 and 42% in 2010. Companies with these types of plans often disclose fewer performance metrics than companies without these plans, in part due to the inclusion of more qualitative measures in umbrella plans rather than quantitative. Similar to other performance-based programs, umbrella plans must follow specific guidelines in order to qualify as performance-based compensation that is in compliance with Internal Revenue Code 162(m), and thus, tax deductible.
INDIVIDUAL OBJECTIVES IN STIPS AND USE OF DISCRETION IN NON-UMBRELLA PLANS
Many companies use individual performance measures in their STIPs. Of the 198 companies with STIPs, 40% of companies included individual, specific objectives for one or more named executive officers (NEOs), including 37% of CEOs. Individual objectives can be based on a combination of financial and non-financial measures. Of the executives that had individual objectives in 2013, 33% had a separate weighting for individual objectives ranging from 10% to 50%. In other cases, the final award was based on an adjustment to a calculated, formulaic amount using discretion or a predetermined plus and minus range.
SETTING STIP TARGETS
The median year-over-year increase in target goals for 2013 was 4%, down from 6% in 2012 and 9% in 2011. At the median, target goals were set at 4% above prior year actual results as compared with 4% in 2012 and 6% in 2011. Thirty-three (33%) of target performance goals were set at levels that were lower than the prior year actual results and 31% of goals were below the prior year target value.
In addition, the range around the targets (25th percentile to 75th percentile) has narrowed, with a difference of 14 percentage points in 2013, down from 35 percentage points in 2011.
PAY-FOR-PERFORMANCE
An examination of 2013 short-term incentive payouts relative to target indicates there was an increase in the percentage of named executive officers (NEOs) that were paid above target. Among companies that reported short-term incentive payouts in 2013, 73% of NEOs were paid at or above target levels as compared with 62% in 2012 and 72% in 2011. On the other hand, fewer companies exceeded targets in LTIPs in 2013 than in 2012. Of the companies that disclosed long-term incentive performance and payout information, the percentage that was paid at or above target was 57% in 2013 as compared with 60% in 2012. Both years were higher than the prior three years due to an improving economy and corresponding company performance.
We also reviewed how STIP target levels are set relative to the prior year target to see if decreasing the target value resulted in companies more able to exceed target. We found that companies with reduced targets from the prior year achieved above target performance at the same rate as companies that increased target performance (59% of companies). Consequently, companies that set targets below the prior year target were no more likely to achieve or exceed target performance as compared with companies that had increased their target.
STOCK OPTION GRANTS RECEDING
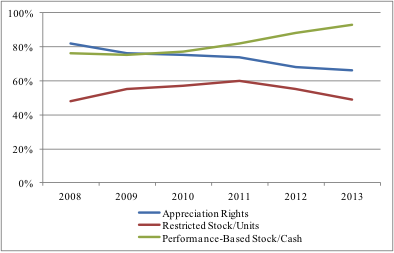
The shift away from appreciation awards (stock options/stock appreciation rights (“SARs”)) and towards performance awards that are earned based on achieving performance goals continued in 2013. For the fourth consecutive year, the prevalence of grants of performance-based awards exceeded the prevalence of time-based appreciation awards, and the gap continues to grow. Since 2009 when the prevalence was about even, performance-based awards have increased to 27 percentage points higher than stock options/SARs (93% vs. 66%).
The collective use of performance-based awards (which includes performance shares/units, performance-based restricted stock, performance stock options, premium stock options, and long-term cash plans) totaled 93% in 2013, up from 88% in 2012, 82% in 2011 and 77% in 2010. On the flip side, the prevalence of stock option/SAR grants, in total, has declined steadily from 82% in 2008 to 66% in 2013.
We attribute the steep shift from appreciation awards to performance awards over the past two years (nine percentage point decrease in stock options/SARs and eleven percentage point increase in performance awards) to the impact of SOP and the influence of ISS, particularly their classification of time-based stock options as non performance-based grants. Not surprisingly, the prevalence of time-based restricted stock/units also dropped in 2012 and 2013 after reaching a high in 2011.
Figure 1: Prevalence of Use
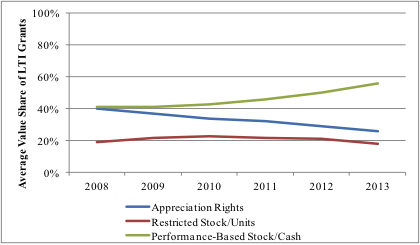
In addition to the decrease in prevalence of appreciation awards, the value provided in the form of stock options/SARs is also declining. In 2008, approximately 40% of the total LTI value was provided in the form of appreciation awards and in performance-based awards (with 20% in time-based restricted stock/units).
By 2013, performance-based awards increased to 56% of the total LTI value with a corresponding decrease in stock options/SARs.
Figure 2: Average LTI Mix