 Sky Blog
Faced with pressures from varied constituencies, compensation committees striving to demonstrate links between pay and performance regularly consider market-based performance measures such as relative total shareholder return[1] (RTSR). Companies reviewing the mix and designs of their long-term incentives (or being pressured into adopting performance-vested awards) may not be comfortable setting reasonable three-year goals—ones that are not a sure bet, but also not unattainable. As compensation committees and management teams review their alternatives, the use of RTSR as a performance metric is typically part of the conversation. Some compensation committees feel a discussion of long-term incentive metrics is remiss without consideration of RTSR, as it is the most prevalent long-term incentive performance metric. For companies finding difficulty setting three-year goals, RTSR requires no goal setting, is simple to adopt, provides a seemingly irrefutable link to shareholder value, and has historically been accepted by shareholders and proxy advisors.
This is the fifth year Exequity has reported on RTSR usage and the seventh year we have tracked prevalence across S&P 500 companies. Historically, RTSR was found primarily within the Energy and Utilities industries, but recent adoptees come from all industries. We analyzed the key design elements of RTSR programs to discern overall trends and implementation differences within industries.
2019 Highlights
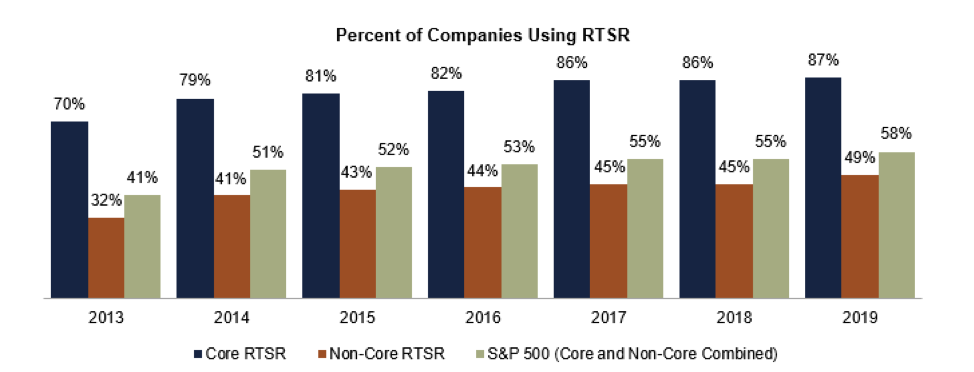
Prevalence of RTSR in long-term incentive plans increased 3% for 2019 to 58% of S&P 500 companies, the largest increase since 2014. RTSR usage among Information Technology companies increased significantly, to 62% in 2019 from 52% in 2018. Usage among companies in most other industries also increased slightly. While RTSR has increased in prevalence, companies in all industries have been reducing its impact. The average weight given to RTSR has declined 7% since 2014, and a majority of S&P 500 companies weight RTSR 50% or less.
RTSR as a discrete metric is the most prevalent method, used by 79% of companies, while 21% utilize RTSR as a modifier. Among companies employing RTSR as either a metric or modifier, 27% use a broad group (e.g., the S&P 500) and 63% use a more focused peer group. The S&P 500 is used by 22% of companies using RTSR and is most common among Consumer Discretionary and Information Technology companies.
Prevalence
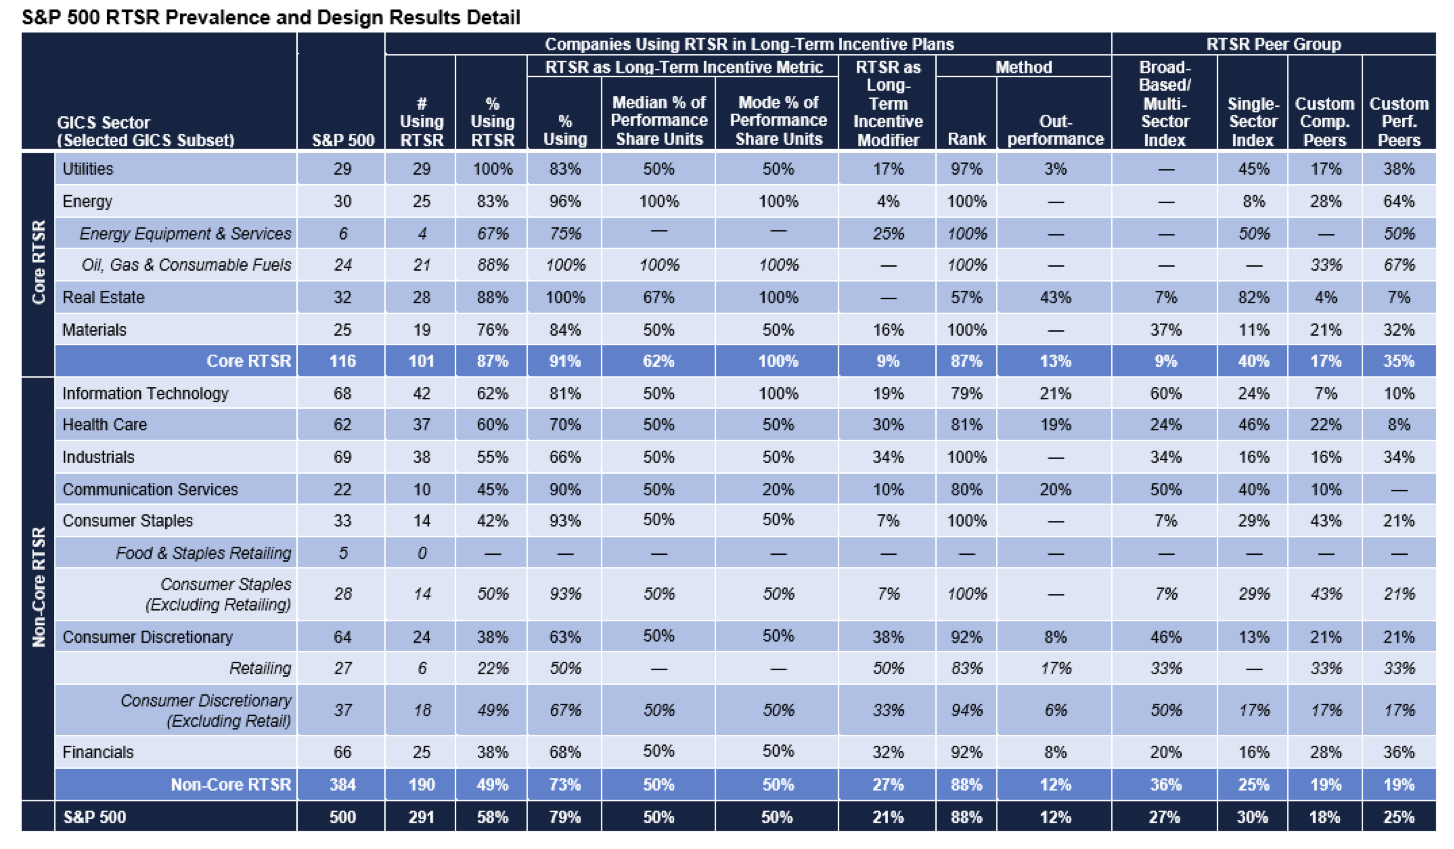
Energy and Utilities companies continue to be the primary users of RTSR across the S&P 500, with 83% of Energy and 100% of Utilities companies using RTSR. Materials and Real Estate companies report high RTSR prevalence as well, 76% and 88%, respectively. Within each of these high-prevalence sectors, companies tend to face similar commodity price pressures or economic similarities, potentially rendering RTSR a more reliable method for identifying financial and operational outperformance via market performance. (We refer to Energy, Materials, Real Estate, and Utilities companies collectively as the Core group of RTSR users, while the remaining companies we refer to as Non-Core.)
We note that Non-Core RTSR companies generally have lesser (or more diversified) commodity pricing (or other) pressures and tend to use RTSR with less frequency than Core companies. Prevalence among other Non-Core companies is generally within the 40%–60% range.[2] We would posit that Non-Core companies experience a more diverse array of stock price pressures than do Core companies by virtue of various industry-specific factors that operate as independent variables, from raw materials and transportation costs to consumer preferences.[3]
The table below reflects the prevalence of RTSR programs within selected industries.
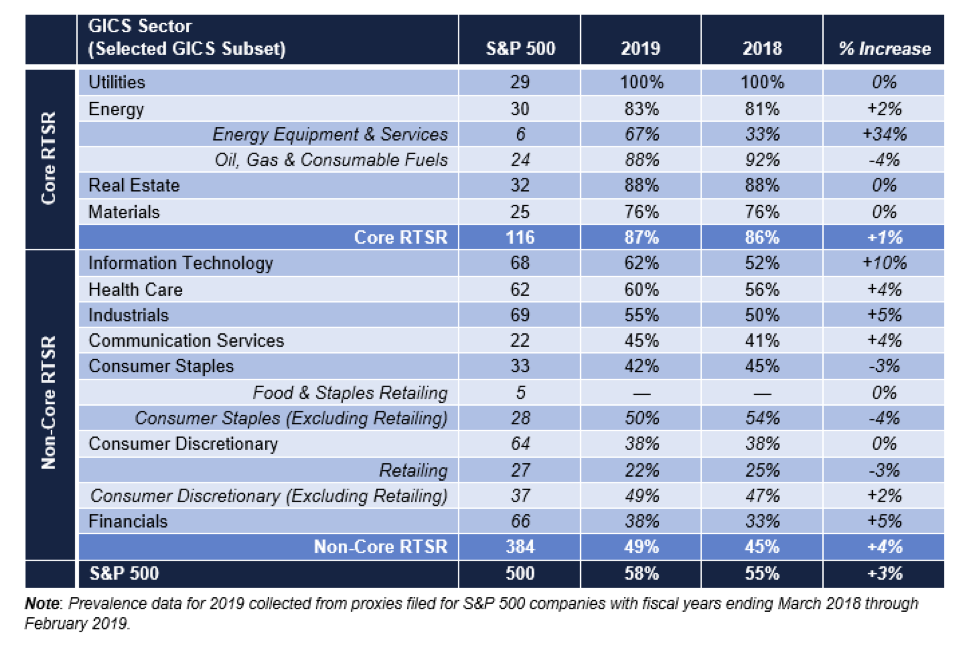
Overall, prevalence of RTSR programs for 2019 is 3% higher than in 2018 and 17% higher than in 2013.
Peer Group
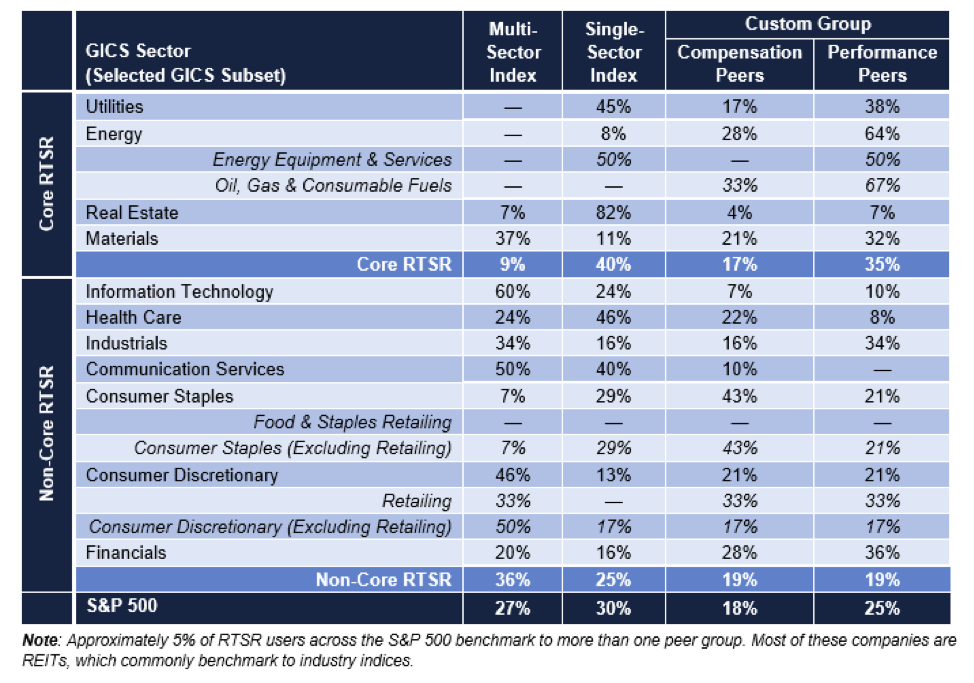
The selection of an RTSR peer group is a critical factor in the establishment of an RTSR program. We separate peer groups used by companies for measuring RTSR into four categories:
- Multi-sector index—a broad-based index comprising multiple sectors such as the S&P 500 or two or more sectors within a broad-based index (e.g., S&P 500 excluding Financials).
- Single-sector index—a focused industry sector index (e.g., MSCI US REIT Index, S&P 500 Utilities).
- Custom compensation peer groups—the custom compensation benchmarking peers.
- Custom performance peers—a custom peer group used solely for performance comparisons.
Peer group selection across industries may reflect the ease—or difficulty—companies have with picking peer groups and the degree to which companies within certain sectors are comparable to each other. Across the S&P 500, 73% of companies use a focused peer group (industry index or custom group) and 27% use a multi-sector group such as the S&P 500. Overall, 57% use peer groups selected by third parties (i.e., an index, either broad or focused).
Core companies, especially Energy, REITs, and Utilities, routinely use focused peer groups (Materials companies are an exception, discussed further below). Within the Energy sector, 100% of Oil & Gas companies benchmark RTSR against custom groups. This is due to the differing impacts oil prices have on companies within various sectors in the overall industry. For example, a rise (or fall) in global oil prices will affect exploration and production companies differently than oil transportation companies or oil refining companies. In contrast, 45% of Utilities benchmark to a sector index group (e.g., Philadelphia Utility Index) and 38% use a custom performance peer group. Utilities generally are more comparable to each other within the sector than are Energy companies. Based on peer group usage trends, however, some Utilities feel there are enough differences (e.g., regulated versus non-regulated asset mix) to warrant use of a custom group.
Peer group usage among Materials companies is somewhat different than other Core companies. Materials companies often have significant problems setting three-year financial goals due to the impact of commodity prices (or other outside forces), not unlike how Energy companies are impacted by the price of oil. The key difference with Materials versus Energy is the diversity of exogenous factors: Materials companies range from chemicals to paper to metals and mining companies, all serving myriad consumers and companies. This creates a significant challenge for identifying peers. Materials companies employing RTSR handle this challenge by moving to two ends of the RTSR spectrum: highly focused custom peer groups (63%) or a broad index such as the S&P 500 (37%). The inherent dissimilarities among Materials companies are likely why just one S&P 500 Materials company benchmarks to the S&P 500 Materials Index companies (one other company benchmarks to the S&P 500 Chemicals Index).
Non-Core companies are more likely to use broad indices, especially Information Technology, Communication Services, and Consumer Discretionary, 60%, 50%, and 46%, respectively. Among Non‑Core companies, Industrials and Financials are more likely to pick custom performance peer groups, possibly due to their ability to confidently pick companies with similar business models than other Non‑Core companies.
RTSR Plan Design
RTSR as a Metric Versus Modifier
Companies typically employ RTSR in one of two ways: as a discrete metric within a performance plan or as a modifier to a financial metric. Used as a discrete metric, RTSR is assigned a weighting within the performance share plan, e.g., a company using RTSR as a discrete metric may weight it 50% and return on capital 50%. As a modifier, RTSR generally adjusts performance plan payouts, which typically measure a non-market metric (e.g., return on capital). In most cases, RTSR modifiers provide for upward or downward adjustment to plan payouts[4] (e.g., a modifier of +/- 25%), though companies may also utilize downward-only or upward-only modifiers.
79% of S&P 500 companies use RTSR as a discrete metric, 21% as a modifier. As a discrete metric, most companies weight RTSR at 50%, but 100% is common in the Energy industry. Use as a modifier is more common among Core companies (27%) than Non-Core companies (9%).
Core companies tend to place greater weight on RTSR in performance plans than Non-Core companies. 40% of Core companies use RTSR as the only performance measure in their performance plans versus 26% of Non-Core companies. The graph below presents RTSR weightings as a percentage of total performance shares across Core and Non-Core companies.
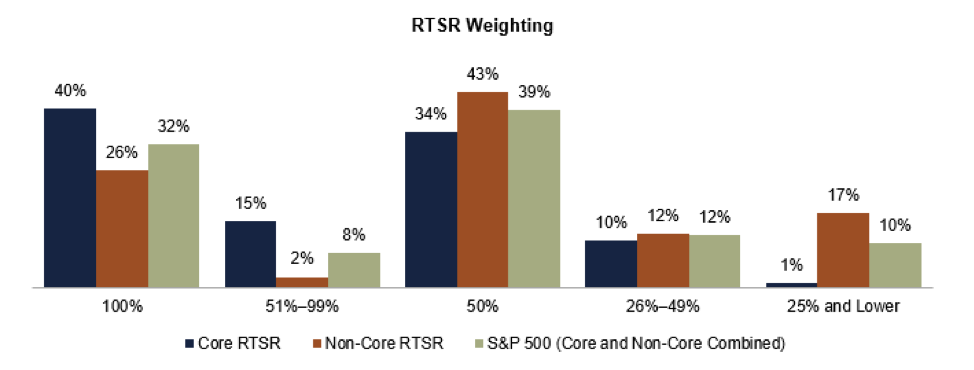
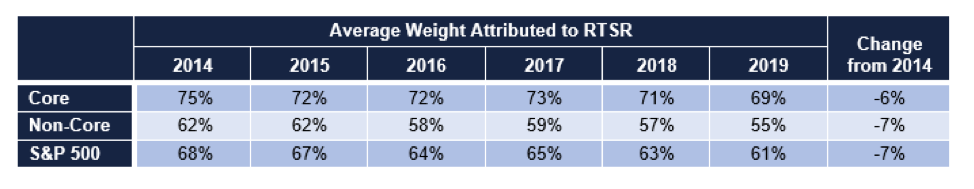
Over the past five years, the average weight given to RTSR as a metric has decreased by 6%. Notably, this trend holds across both Core and Non-Core companies. The table below displays the average weight attributed to RTSR (excluding RTSR modifiers).
RTSR Performance Measurement
Performance measurement methodology is varied across S&P 500 companies. Most companies (89%) with RTSR plans use percentile rank or numerical rank methods for benchmarking relative performance. Among these companies, 86% use the percentile rank method, and 14% a numerical rank method. Of those using the numerical rank method, roughly 50% are Energy companies. An alternative to the traditional ranking method is to measure the spread in TSR relative to a defined barometer of performance, such as an index composite or the median TSR of a peer group[5] (sometimes referred to as an “outperformance” method). This method is used by 12% of S&P 500 companies but is most common among REITs, with roughly 43% measuring RTSR against an index composite figure or peer group median. This method is less than 10% prevalent across non-REIT S&P 500 companies.
The table below identifies the ways in which RTSR is used within selected industries.

Other Design Elements
Pay/Performance Leverage
Unlike other design elements of RTSR plans, pay/performance leverage varies less across industries.

While the single most common maximum performance percentile remains at the 75th, it is a majority practice for companies to require performance to exceed this level. Nearly 60% of all S&P 500 companies require performance above the 75th percentile for RTSR plans to pay at maximum. Core companies tend to require higher performance levels for a maximum payout than Non-Core companies, with 67% of Core companies requiring performance in excess of the 75th percentile, versus 48% for Non-Core companies. The general trend is towards increased performance requirements, with companies requiring higher performance levels to achieve a maximum payout. The table below displays maximum performance percentiles required to achieve maximum payouts.

Above-Median Target Performance Percentile
Proxy advisors have subjected RTSR plans to an increased level of scrutiny and occasionally criticized companies for prescribing a target-level payout at median performance. In 2016, ISS went so far as to suggest that targeting median performance may not always be defensible. Despite this ISS criticism, 91% of S&P 500 companies target the peer group median for their awards granted annually (a decrease of 2% from 2018 of companies targeting above-median performance). Among those targeting above the median, 41% target the 60th percentile, 56% the 55th percentile, and one company targets the 75th percentile. In cases where RTSR is used as a performance measure for a one-time award, companies may receive more pointed criticism from proxy advisors for targeting the median.
Negative TSR Cap
An increasing number of companies are imposing a “cap” on RTSR payouts when absolute TSR is negative. Compensation committees are increasingly uncomfortable with the possibility of above‑target RTSR payouts when shareholder returns over the measurement period are negative. Shareholders and proxy advisors tend to favor capping awards at target when absolute TSR is negative. Currently, 25% of S&P 500 companies disclose caps on RTSR awards. Despite the attention negative TSR caps have received, prevalence increased just 5% from 2017 and 2% since 2018.
Stock Price Averaging
Since RTSR is a naturally volatile incentive metric, companies commonly employ stock price averaging to smooth out the impact of daily stock price movements on relative performance at the beginning and end of the performance period. Among those companies disclosing averaging periods, approximately 60% use a period of one to four weeks (e.g., five trading days to 30 calendar days), with 20 trading or 30 calendar days being the most prevalent periods. Among the remaining companies, 25% use a period of five to ten weeks, and 15% a period of 90-calendar days or longer.[6] Stock price averaging periods are commonly viewed as shareholder-neutral.
Discussion
RTSR’s rise may be attributable to a confluence of factors, such as say-on-pay and the influence of proxy advisors pressuring companies to adopt performance-vested long-term incentives. Companies feeling pressure to adopt performance-vested awards and respond to unfavorable say-on-pay outcomes often turn to RTSR. It has been accepted as an objective, shareholder-friendly method for companies to demonstrate a commitment to performance-based pay that does not require a company to set goals—a difficult exercise for some companies.
Will the tide ever turn on RTSR?
In 2018, ISS acquired EVA Dimensions LLC, a firm founded by Bennett Stewart, one of the original creators of Economic Value Added (EVA). Mr. Stewart, now an ISS Senior Advisor, and ISS have published several whitepapers touting EVA as an alternative method for identifying companies with superior performance and how it can be used in relative performance assessments.[7] During the 2019 proxy season, ISS included relative EVA performance assessments in its proxy reports (in the pay-for-performance section). In May 2019, ISS published materials suggesting that some companies may be too reliant on RTSR in their performance-based pay programs. This observation by ISS is particularly notable since ISS can arguably be credited with generating the tide of companies adopting RTSR over the past seven years. When ISS embraced RTSR in its pay-for-performance tests, companies under pressure from ISS to change their pay programs regularly turned to RTSR because it had the appearance of being implicitly sanctioned by ISS. After all, if RTSR is relied on by ISS as a fair barometer of performance measurement, it must be a good measure to assuage ISS and investors that a company’s long-term incentives are sufficiently performance-based. Looking ahead to 2020 and beyond, with ISS’s laser focus on EVA, momentum may be building towards ISS’s research arm incorporating EVA into its policies, possibly as a counterweight to RTSR.[8] ISS is expected to incorporate EVA as a “modifier” in the quantitative tests, similar to the current GAAP-based Financial Performance Analysis.
Regardless of ISS’s views (or its potentially changing views), companies are unlikely to entirely abandon RTSR anytime soon, though we expect the trend towards reducing RTSR’s impact will continue. With ISS’s embrace of EVA, some compensation committees feel inclined to discuss and analyze the merits of EVA. When ISS adopted RTSR in its quantitative tests, many companies under shareholder/ISS pressure (or seeking to avoid such pressure) adopted RTSR in response (or as a shield). Time will tell whether companies (and investors) embrace EVA as they did RTSR when ISS incorporated it into its quantitative pay-for-performance tests.
ENDNOTES
[1] Total shareholder return is defined as the change in stock price plus reinvested dividends.
[2] In prior years this range was 40%–50%, but prevalence has increased across Information Technology, Health Care, and Industrials sectors.
[3] For example, the share price of a Health Care equipment company reliant upon a certain precious metal (presumably provided by a Materials company) may exhibit sensitivities to the price swings of this commodity, but this will be one of many factors impacting this hypothetical Health Care company’s share price. The precious metal company’s share price will show much greater—and direct—sensitivity to the same price swings.
[4] Modifiers may be additive or multiplicative. Assuming a pre-modifier payout of 125%, a +25% additive modifier would increase the payout to 150% (125% + 25%) and a multiplicative modifier to 156% (125% + 25% x 125%).
[5] A company employing this method compares its TSR to that of the index composite figure and adjusts payouts based on the spread between the two figures. For example, if the company’s TSR is 15% and the index composite TSR is 5%, then the company beat the index by 10 percentage points. Assuming a payout of 2% of each percentile of outperformance, this would yield a 110% payout.
[6] Not all companies using averaging periods disclose them in proxy filings.
[7] Exequity’s take on some of these contentions: https://www.exqty.com/newsroom/iss-eva-and-economic-voodoo.
[8] The interplay between ISS’s need for revenue generation from its consulting arm and the voting policies adopted by ISS’s research arm is a topic outside the scope of this Client Briefing.
This post comes to us from Exequity LLP. It is based on the firm’s client briefing, “2019 Relative TSR Prevalence and Design of S&P 500 Companies.”