Institutional Shareholder Services (ISS) recently introduced Economic Value Added (EVA) as its latest approach to measuring company performance. Recent white papers from ISS, authored by Bennett Stewart (ISS Senior Advisor), who, along with former business partner Joel Stern, developed the general EVA framework roughly 40 years ago, implicitly suggest that EVA is the solution to identifying companies creating value and therefore, the superior method for assessing pay for performance. As ISS states:[1]
“EVA is an established standard in measuring, analyzing, projecting, valuing, and discounting a firm’s underlying economic profit rather than its accounting profit. With coverage of 16,500+ public companies, this solution enables investors to measure, analyze, and value corporate performance and inform investing decisions.”
Now a proponent and purveyor of EVA, ISS is marketing its product.[2] ISS has published a significant amount of material further touting EVA, its “link” to total shareholder return (TSR), and more recently, the provocatively titled EVA, not EBITDA: A Better Measure of Investment Value. In this installment, its author, Mr. Stewart, makes a startling claim: “EBITDA is far less correlated to market value than is commonly thought.” Curious. This Client Briefing examines ISS’s contention that EVA is a superior gauge of “investment value” over EBITDA.
Key Findings
So, is EVA a better gauge of investment value than EBITDA? Not necessarily. The data we analyzed does not support ISS’s contentions that EBITDA is “less correlated than commonly thought” and that its EVA formulation is superior. Unlike ISS, we measured “investment value” the way investors do, by comparing stock prices to EBITDA and EVA over time. Based on the data available to us, EBITDA is the better gauge.
The guiding logic of EVA is sound. In practice, however, EVA must be customized for individual companies based on nonpublic, detailed financial information—and even with that, EVA is notoriously difficult to calculate, let alone understand (to many, it is economic voodoo, not value). In contrast, EBITDA is simple to calculate and more correlated with stock price in our modeling. In our view, it is presumptuous of ISS to tout its generic (black box) formulations as an effective solution. Further, if indeed ISS’s EVA is superior to EBITDA, ISS should not shy away from shedding more light on its calculations and assumptions. Instead, ISS opts to hide the details, choosing to violate its own standards it strongly suggests companies follow: disclosure, transparency, and rigor. Otherwise, the song remains the same for ISS: “Do as we say, not as we do.”
What Is EVA?
It’s complicated. In principle, EVA reflects after-tax profits in excess of a minimum return threshold. In simple terms, if a company needs to make a 10% return on a project to be a good investment (use of its capital), EVA is the after-tax operating profit above the 10% hurdle. The 10% hurdle is based on a company’s cost of capital. The cost of capital can be loosely defined as the cost of money for a company. In other words, if a company wants to invest in a project and needs to raise money to do so, it can borrow money or sell shares of stock to generate capital. Capital has a cost based on a company’s mix of equity and debt, among other factors.[3] If the project’s returns exceed the cost of capital, that is good (value creation). If a company invests in projects that have returns below its cost of capital (value destruction), that is bad, because the company would be better off taking no action at all. As previously noted, the underlying logic of EVA is sound. The application of EVA is where problems arise.
Calculating EVA requires numerous adjustments to GAAP financial statements (and, in practice, often requires detail not found in public financials). In its various white papers (spanning more than 100 pages of EVA material in total), ISS provides some information on the various adjustments it makes but does not provide details on exactly how it carries out these adjustments. ISS’s approach to EVA further complicates matters: EVA is not just one, but four discrete measurements:
- EVA Margin: EVA divided by revenues;
- EVA Spread: EVA divided by total capital;
- EVA Momentum Versus Sales: Change in EVA divided by lagging sales; and
- EVA Momentum Versus Capital: Change in EVA divided by lagging capital.
Why Use EVA?
For investors, the rationale for using EVA in making investment decisions is simple: Investing in companies with high EVA should theoretically lead to excess returns above what the general market would offer. In practice, it is not clear that it works. How can the EVA calculation be standardized in a way that is applicable to all companies, given varying business models? How many investors truly use EVA as their valuation model of first choice?
For management teams, EVA seems sensible. Pursuing high EVA projects should lead to greater profits, leading to higher stock prices and TSR. Cost of capital calculations are routine for many companies—and they may be in a better position to calculate their “true” cost of capital better than any outsider. In truth, many companies have found value in adopting EVA-style financial management systems. Despite this, EVA is rarely embedded in compensation programs. In fact, many companies (possibly a majority) that have implemented EVA systems in their compensation programs have replaced them with metrics requiring fewer adjustments and less effort to manage, while supporting achievement of the same goals and being better understood by participants. While proponents of EVA argue that it is a more perfect measure of financial performance, due to its complexity and lack of understanding by participants, it is ineffective as an incentive measure for most companies. If participants do not understand EVA, they may ignore it or dismiss it entirely, negating its purpose.
What Is EBITDA? Earnings Before Interest, Taxes, Depreciation, and Amortization
EBITDA can easily be calculated. For example, a participant in an incentive compensation program with EBITDA as a performance metric can calculate EBITDA by starting with net income, adding back interest paid, taxes paid, depreciation, and amortization. Calculating EBITDA requires few adjustments. And the necessary information is readily and publicly available in 10-Ks. Public companies using EBITDA as a metric disclose their calculations and how they tie to financial statements in their proxies.
Comparing EVA and EBITDA to Value—But Which Value?
In its publication comparing EVA to EBITDA, ISS draws comparisons to “investment value.” ISS defines “investment value” as total enterprise value (TEV). TEV is a measure of total company value: market capitalization plus net debt.[4] After dispensing with EBITDA as a predictor of “value,” ISS draws other comparisons between EVA formulations and contrived measures of “value.” Even for financially and statistically minded professionals, Olympic-level mental gymnastics are required to comprehend what is happening with ISS’s calculations. ISS shifts from TEV to TEV derivations, from EVA to EVA derivations, sometimes mentioning what is happening in the footnotes. To make a long story short, the upshot seems to be that profitable companies carry higher market values—there is a correlation between profitability and market value. Arriving at this conclusion is unlikely to win any Nobel prizes.
The investors ISS seeks to provide guidance to, however, more often measure their returns using stock price, not TEV (let alone TEV derivations). The reason is that changes in stock price more directly relate to actual investment returns than changes in TEV. Therefore, ISS’s contention that EVA is superior to EBITDA is based on a measure of “value” at odds with what its subscribers use.
ISS requires dozens of pages to explain the superiority of its EVA measures (and its EVA derivations) over EBITDA. In contrast, EBITDA can be explained in several sentences (see above). If describing how EVA is linked to shareholder value requires that much explanation, it is no wonder that so few companies use EVA. It is the difference between “trust us” or “see for yourself.” With its EVA formulations, ISS is saying, “trust us.” EBITDA is simple: “See for yourself.”
Exequity’s Analysis of EVA and EBITDA Versus TEV and Stock Price
To explore the relationship between EVA, EBITDA, and “value” (TEV and stock price), we generated a sample of 428 current S&P 500 companies with seven years of available financial data. We calculated EVA using financial data provided by S&P Capital IQ. The EVA calculation we used was also provided by S&P Capital IQ from a template available to its users. We analyzed both EVA and EBITDA on a 12‑month basis, measured quarterly, and compared this information to stock prices and TEVs as of the end of each quarter.[5] To be as transparent as possible (without violating the terms of our user agreement with S&P), we are publishing the formula we used and the list of companies on our website.
We reviewed the data in two ways. First, we analyzed each company individually over time on a linear basis. The reason we looked at data in a linear manner is to identify the degree to which EVA and EBITDA track with individual company stock prices over time. Second, we looked at the aggregated relationship between EVA, EBITDA, and stock price for all companies at a point in time. The goal of this second analysis is to determine whether higher EBITDA or higher EVA reflects superior performance.
EVA and EBITDA Versus Stock Price and TEV—Individual Company Analysis
In our calculations, EBITDA is the clear winner. We find that for the typical company EBITDA is more highly correlated with stock price and TEV than is EVA over the period measured. At the median, the correlation between stock price and EBITDA is very high, 0.73, compared to 0.36 at median. In fact, correlations between EBITDA and stock price are always at least twice as highly correlated as between EVA and stock price.
Correlation of TEV and Stock Price to EVA and EBITDA
| Average | Median | |||
| EVA | EBITDA | EVA | EBITDA | |
| TEV | 0.25 | 0.63 | 0.36 | 0.76 |
| Stock Price | 0.27 | 0.57 | 0.36 | 0.73 |
Note: These calculations measure the correlation of financial measures in dollars on a linear basis (i.e., we measured
correlations by company over a five-year measurement period and averaged the correlations of the individual companies.
We did not transform the data (e.g., log transformation) due to instances of negative numbers. We did test a cube root
transformation and found results were consistent with those displayed above.
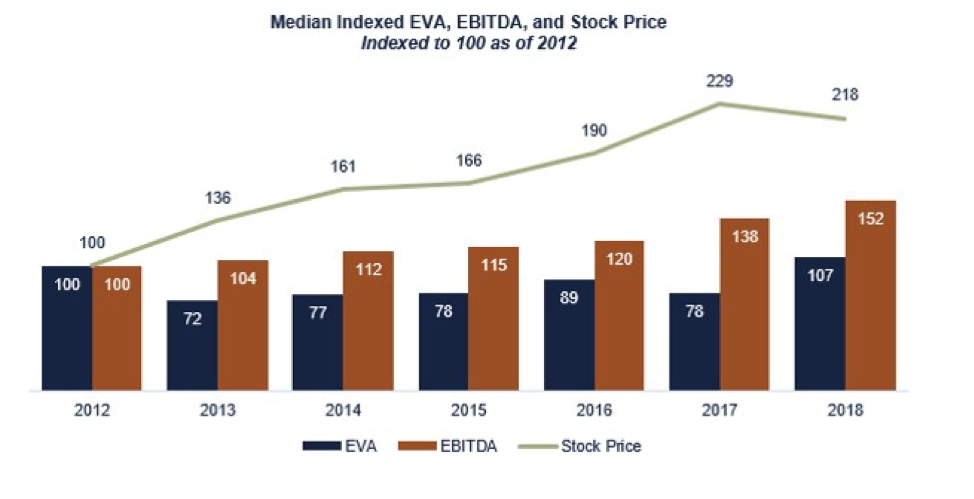
The graphic below depicts a summary of the data at median for EVA, median EBITDA, and median stock price, all indexed to 100, measured annually. Over the period, EVA increased 7%, EBITDA 52%, and stock price (TSR) 118%.[6] EVA growth over this period clearly fails to track stock price as closely as does EBITDA growth.
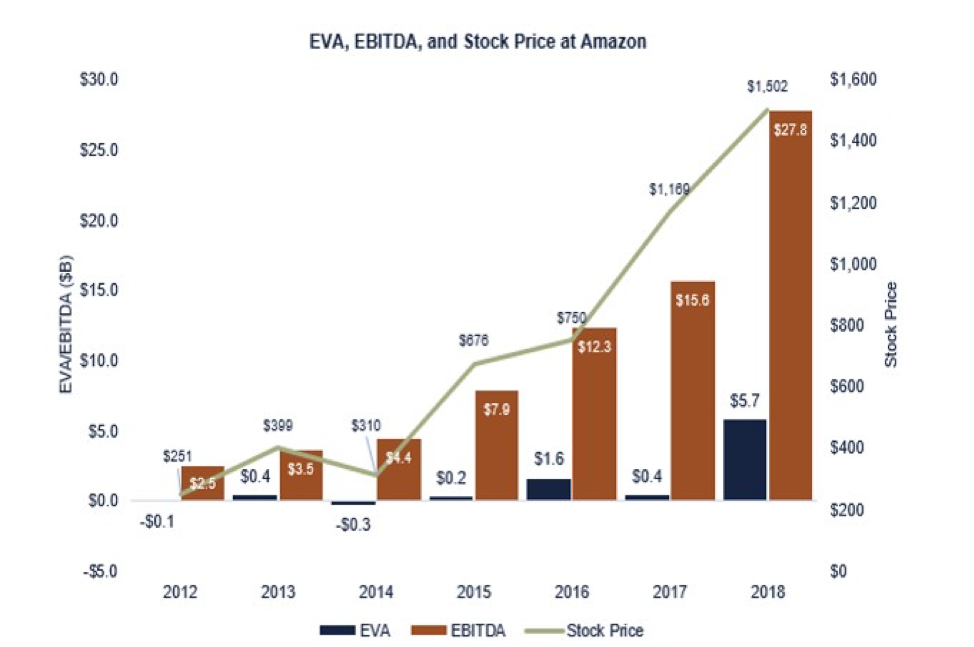
Example: Amazon.com, Inc.
In another of its whitepapers, The Link Between TSR and EVA, ISS touts how EVA is a predictor of Amazon’s growth.[7] And indeed, EVA is well-correlated with stock price, reflecting a 0.65 correlation. What is better than EVA? EBITDA, with a correlation of 0.97. EBITDA and stock price at Amazon have moved in tandem. In its more recent EVA, not EBITDA paper, ISS does not reprise its Amazon example.
EVA and EBITDA Versus Stock Price and TEV—Aggregate Analysis
What about EVA growth? Do higher EVA or EBITDA growth companies correlate with higher stock prices? We next tested whether EVA growth (as a percent) was more associated with higher stock price performance (TSR as a percent) than higher EBITDA growth. If EVA is increasing over time, investors should reward such performance by buying shares, increasing stock prices. For this measurement, we calculated correlations as of points in time—the end of each quarter.
Here again, EBITDA is more highly correlated with performance than is EVA growth. EBITDA growth correlations are mixed, ranging from -0.08 to 0.39, whereas EVA growth correlations are consistently low, as demonstrated on the following page. Over the past two years, EBITDA growth is slightly lower in two instances, where neither EVA growth nor EBITDA growth were well-correlated with TSR. In other quarters, EBITDA growth was more highly correlated with TSR than EVA growth.
Correlation of EVA Growth and EBITDA Growth to One-Year TSR for Quarters Ending 2017 to 2018
| 3/31/2017 | 6/30/2017 | 9/30/2017 | 12/31/2017 | 3/31/2018 | 6/30/2018 | 9/30/2018 | 12/31/2018 | |
| EVA Growth | 0.03 | 0.03 | 0.09 | 0.00 | 0.06 | 0.08 | 0.02 | -0.06 |
| EBITDA Growth | 0.08 | -0.03 | 0.13 | 0.21 | 0.27 | 0.39 | 0.32 | -0.08 |
Note: Bolded text indicates higher correlation. Correlations in 2017 and for the quarter ended December 2018 are not meaningfully different. For the periods between December 31, 2013 and December 31, 2016, the average correlation between EVA growth and TSR is 0.05 and for EBITDA and TSR, 0.12.
Reading ISS’s material, one might believe higher EVA will always be associated with higher TSR. We found that the highest-performing companies based on EVA margin did sometimes have the highest performance. However, if we step back in time, the results are mixed. As a supplemental test, we calculated the percentile rank ranges of EVA margin (EVA divided by sales, a measure ISS focuses on) and averaged TSR results across percentile rank ranges. The results are muddy at best. For example, for the 90th percentile and higher of EVA performance for the year ending in December 2018, the average TSR was 0%. For the bottom decile, the average TSR was -15%. Interestingly, while in 2017 and 2018 the highest EVA margin companies had the best returns, the opposite was true in 2016: the bottom decile EVA margin companies had higher returns (24%) than the top decile (13%).
However, given the spread of EVA margins (ranging from high to low), the TSR differences between the highest and lowest EVA margin performers may not be meaningful, especially considering the generally modest to poor correlations between EVA and stock price. Lastly, given how stock markets can swing based on macroeconomic (or other) factors, we would not consider TSR differences between high EVA and low EVA companies to be as conclusive as the linear analysis discussed earlier. The aggregated results are inconsistent quarter to quarter across these (and other) measurements conducted as a part of our analysis into EVA. The linear results presented earlier are more consistent—and they favor EBITDA.
Final Thoughts
While we do not suggest any companies already successfully using EVA for financial management (or in compensation programs) to stop doing so based on our analysis, we do find evidence to counter ISS’s contention that its EVA calculation is superior to EBITDA as a gauge of “investment value.” It is possible that a customized EVA calculation could be constructed to be as strongly, or better, correlated with stock price than EBITDA. But to do so, EVA needs to be tailored to each company, based on details likely unavailable in GAAP financials. We question ISS’s ability to draw meaningful conclusions about absolute company performance from its generic EVA calculations. If absolute EVA comparisons are of limited value, will relative EVA comparisons be any more meaningful?
ISS’s embrace of EVA should give investors and companies impacted by its vote recommendations reason for concern. With its recent white papers, ISS purports to have discovered a silver bullet to not only solve its pay-for-performance methodology riddle, but possibly generate new revenue streams by selling EVA analytics to its clients. While ISS claims to not favor use of TSR in incentive plans, it is no coincidence that as say-on-pay became an outlet for shareholder concerns with pay for performance, ISS’s use of TSR as the focal point of its quantitative tests influenced the adoption of TSR as a performance measure in long-term incentive plans. TSR is an imperfect measure, but it is related to shareholder value. Will companies feel pressure to adopt EVA if ISS formally adopts it into its quantitative tests? We do not think most companies will buy it—and our research suggests they might be better rewarded by shareholders for growing EBITDA over focusing on complicated, opaque alternatives.
ENDNOTES
[1] Source: https://www.issgovernance.com/solutions/iss-analytics/eva/ as of June 2019.
[2] ISS has chosen to keep its EVA formulations tightly guarded, publishing high-level concepts. We are showing the EVA definition and calculations for this analysis on our website.
[3] The derivations of cost of capital and the capital asset pricing model are beyond the scope of this Client Briefing.
[4] The definition of TEV is Market Capitalization + Book Value of Total Debt + Book Value of Preferred Stock + Book Value of Minority Interest − Cash and Short-Term Investments, per S&P Capital IQ.
[5] ISS’s calculations appear to be based on data effective as of a point in time. It appears ISS may be comparing data from a single point in time, e.g., financial data available in its database as of March 2019.
[6] Some observers may notice that if the period were indexed to 2013 instead of 2012, EBITDA and EVA would be close to equivalent in 2018. We note that EVA spikes to this level only in 2018—it catches up to EBITDA at the very end (ending indexed values for EVA, EBITDA, and stock price, respectively: 149, 146, 160). Over the period measured, EBITDA grew steadily along with stock price increases. EVA moves inconsistently with stock price.
[7] Interestingly, ISS does not use Amazon’s actual stock price, market cap, or TEV as a predictor; it uses EVA and “Market Value Added,” a measure related to EVA intended to quantify value creation. Discussion and critique of the various EVA metrics constructed by ISS and Mr. Stewart are beyond scope of this Client Briefing.
This post comes to us from Exequity. It is based on the firm’s memorandum, “ISS, EVA, and Economic Voodoo,” dated August 20, 2019, and available here.