 Sky Blog

In 2001, hedge fund manager Cliff Asness co-wrote a famous paper, Do Hedge Funds Hedge?1 Sixteen years later, amid significant changes in the industry, it’s worth asking, Are hedge funds worth as much as they say they are? And what explains the expectation, as reported by Preqin,2 that outflows from hedge funds will continue in 2017 (I suspect either performance-related or cost-related issues, or both)?
Using the CSFB/Tremont Hedge Fund Index’s monthly returns from January 1994 to January 2014,3 I conducted a study similar to the one described in Asness’s paper. I tried to determine whether hedge funds provide investors with diversification benefits and deliver risk-adjusted returns above market returns. As a market benchmark, I used the S&P 500 Index and ran multiple regression analyses of monthly index returns. Doing so resulted in various alphas and betas corresponding to different hedge fund styles (also called tilts).
First, I examined the claim that hedge funds have intrinsic market exposure but are still an alternative investment class that provides (some) diversification benefits. That is, as Asness puts it: “hedge funds can be viewed as selling […] 1) an S&P 500 index fund […] and 2) some manager skills.” In order to estimate hedge fund market exposure, I compared monthly returns of different hedge fund styles with those of the S&P 500 Index (mathematically, I ran a regression of monthly hedge fund returns on the S&P 500 returns; see Regression 1). The results are shown in Table 1.
Table 1 suggests that, on average, hedge funds create value for investors. Indeed, looking at the “Overall” category, which is the aggregate index returns, I observed an excess return (alpha) of 3.73 percent above the expected beta of 0.29. Furthermore, I noticed that strategies such as Convertible Arbitrage, Event-Driven, Distressed Securities, Multi Strategy, Risk Arbitrage, Global Macro and Long/Short Equity exhibit a strong relationship between a manager’s skills and the fund’s excess return4. Finally, I noted that Managed Futures provide investors with negative market exposure (beta of minus 0.07) and an excess return of 3.14 percent. This is very beneficial given that risk reduction is present (arising from the negative beta) and value is being created (through alpha). Short Biased funds also provide negative exposure with a beta of minus 0.86 but at a certain cost: alpha is minus 0.77 percent. I suspect this particular type of fund suffered tremendously in the 2009-2014 period, when the S&P 500 Index went from 789.17 to 1782.59 (mathematically, the S&P 500 Index increased by a geometric average of about 14.5 percent over the 2009-2014 period).
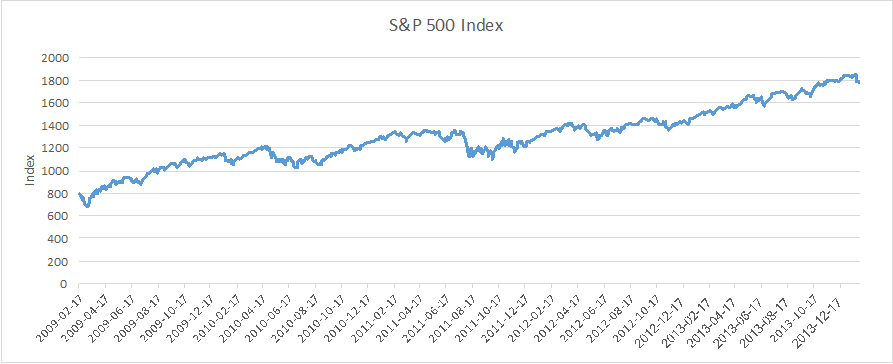 Historical Values for the S&P 500 Index
The simple regression above is a good starting point. However, it suffers from several drawbacks. First, it is almost certain that survivorship bias5 is present in the Short Bias category, given the strength of the market over the 2009-2014 period (see graph above). Hence, compared with other hedge fund styles, there is an upward bias. In other words, the annual alpha for the Short Bias category should be even lower. Second, hedge funds (especially Convertible Arbitrage) hold illiquid and hard-to-price securities that may create what Asness calls in his paper “non-synchronous movements in returns”. In other words, investors may experience month-end misreporting because of stale prices resulting either from illiquidity or managed pricing (managers purposely reporting specific values to make their funds less volatile and less correlated with the market).
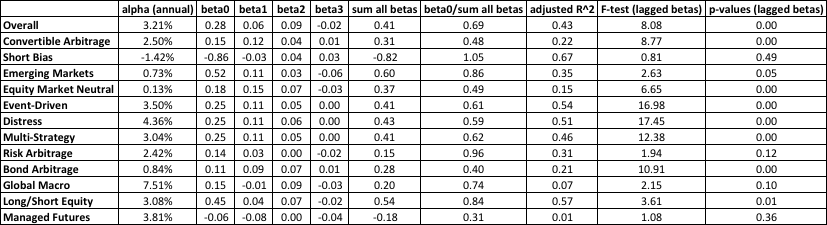
In order to obtain more robust results, I turned my attention to lagged betas: the betas from previous months6. The idea was to “reveal” the slow adjustment that takes place due to stale or managed pricing (if hedge fund managers invest in illiquid securities or manage pricing, the change in securities may not show up in the current month but in the following months). Including lagged betas in my analysis will provide a better measure of historical market risk beta. The results are shown in Table 2.
Table 2 exhibits some intriguing changes compared with Table 1. First, I observed that strategies such as Convertible Arbitrage, Equity Market Neutral, Event-Driven, Distressed Securities, Multi-Strategy, Bond Arbitrage and Long/Short Equity exhibit illiquidity or managed pricing characteristics7 (see last column “p-values (lagged betas) in Table 2). Also, for the aggregate hedge fund index (“Overall” row in Table 2), the beta increases from 0.29 (see Table 1 column (3) “beta”) to 0.41 (see Table 2 column (7) “sum all betas”) when accounting for lagged betas.
Furthermore, I noted sharp increases in beta for Convertible Arbitrage, Equity Market Neutral, Bond Arbitrage, and Managed Futures while Short Bias and Risk Arbitrage seem to be the least affected categories when I looked at lagged betas (see Table 2 column (8) “beta0/sum all betas”). Finally, the relatively small increase in beta for Long/Short Equity and Emerging Markets hedge funds (see Table 2 column (7) “sum all betas”) when accounting for lagged betas is positive given that those funds often invest in small capitalization stocks (hence less liquid investments) and illiquid private securities.
To summarize, Table 2 suggests that when accounting for illiquidity or managed pricing, hedge funds tend to hedge a lot less than initially thought. Indeed, for most hedge fund categories, the lagged betas are larger than the standard beta. Specifically, it appears that “poor performers,”8 i.e. hedge fund styles such as Managed Futures, Convertible Arbitrage, Bond Arbitrage and Equity Market Neutral, do not provide investors with appropriate diversification benefits. When accounting for lagged betas, the actual market exposure (beta) is two times higher. This is particularly detrimental to investors holding hedge funds-related investments in their portfolio because of their supposed de-correlation with the markets. I briefly mention the “good performers”9 as Distressed, Event-Driven and Multi Strategy with a market exposure (beta) close to 0.4 (see Table 2 column (7) sum all betas) when accounting for lagged betas, and pay special attention to the “top performers”10 as Short Bias, Risk Arbitrage, Long/Short Equity and Emerging Markets in which market exposure does not vary significantly with lagged betas. Hedge Funds constitute an interesting alternative asset class in which market exposure and risk-adjusted returns (alpha) need to be carefully evaluated. From a performance perspective, investors would benefit from looking at lagged betas.
There are other factors at play in evaluating hedge funds (including transparency, lock-up periods, fees, reputation). Indeed, although poor performers in the regressions, Arbitrage strategies (Convertible and Bond Arbitrage specifically) will be in high demand this year, according to Preqin’s 2017 Predictions11. Similarly, Equity Strategies (Long/Short Equity for example) have one of the highest proportions of respondents for decreasing exposure (according to Preqin’s 2017 Predictions) even though they passed the “lagged betas test” with flying colors. Finally, given current valuation levels (S&P 500 Index close to a P/E ratio of 2412 and US equities crossing the 10th decile valuations13 for example) one should expect higher allocations toward hedge funds as a means to reduce downside risk. Overall, hedge funds remain an alternative asset class, both complex and peculiar.
Appendix
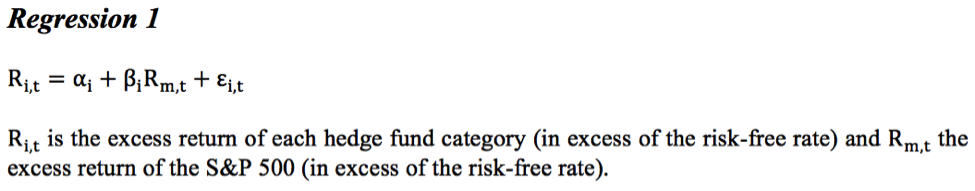
Table 1
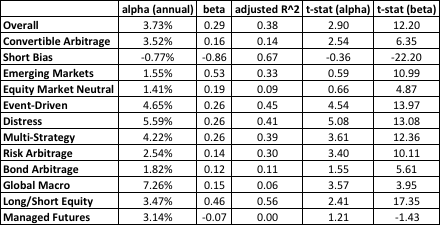
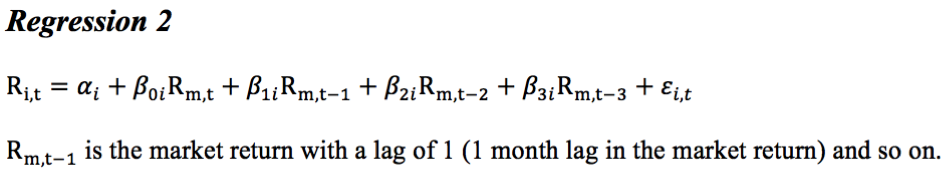
Table 2
Appendix: Variable Hedge Fund Definitions
CFSB/TREMONT SUBINDEX CATEGORIES
Convertible Arbitrage
This strategy is characterized by hedge investing in the convertible securities of a company. A typical investment is long on the convertible bond and short on the common stock of the same company. Positions are designed to generate profits from the fixed income security as well as the short sale of stock, while protecting principal from market moves.
Event-driven
This strategy is defined as equity-oriented investing designed to capture price movements generated by an anticipated corporate event. There are four popular sub-categories in event- driven strategies: risk arbitrage, distressed securities, Regulation D, and high yield investing.
Risk Arbitrage
Specialists invest simultaneously in long and short positions in both companies involved in a merger or acquisition. Risk arbitrageurs are typically long the stock of the company being acquired and short the stock of the acquirer. The principal risk is that the deal fails to close.
Distressed Securities
Fund managers invest in the debt, equity, or trade claims of companies in financial distress or bankruptcy. The securities of companies in need of legal action or restructuring to revive financial stability typically trade at substantial discounts to par value and thereby attract investments when managers believe a turn-around will occur.
Regulation D, or Re. D
This sub-set refers to investments in micro and small capitalization public companies that are raising money in private capital markets. Investments usually take the form of a convertible security with an exercise price that floats or is subject to a look-back provision that insulates the investor from a decline in the price of the underlying stock.
High Yield
Often called junk bonds, this sub-set refers to investing in low-graded fixed-income securities of companies that show significant upside potential. Managers generally buy and hold high yield debt.
Equity Market Neutral
This investment strategy is designed to exploit equity market inefficiencies and usually involves being simultaneously long and short on matched equity portfolios of the same size within a country. Market neutral portfolios are designed to be either beta or currency neutral, or both. Well-designed portfolios typically control for industry, sector, market capitalization, and other exposures. Leverage is often applied to enhance returns.
Fixed Income Arbitrage
The fixed income arbitrageur aims to profit from price anomalies between related interest-rate securities. Most managers trade globally with a goal of generating steady returns with low volatility. This category includes interest-rate swap arbitrage, U.S. and non-U.S. government bond arbitrage, forward yield curve arbitrage, and mortgage-backed securities arbitrage. The mortgage-backed market is primarily U.S.-based, over-the-counter, and particularly complex.
Long/Short Equity
This directional strategy involves equity-oriented investing on both the long and short sides of the market. The objective is not to be market neutral. Managers have the ability to shift from value to growth, from small to medium to large capitalization stocks, and from a net long position to a net short position. Managers may use futures and options to hedge. The focus may be regional, such as long/short U.S. or European equity, or sector specific, such as long and short technology or healthcare stocks. Long/short equity funds tend to build and hold portfolios that are substantially more concentrated than those of traditional stock funds.
Emerging Markets
This strategy involves equity or fixed income investing in emerging markets around the world. Because many emerging markets do not allow short selling or offer viable futures or other derivative products with which to hedge, emerging market investing often employs a long-only strategy.
Global Macro
Global macro managers carry long and short positions in any of the world’s major capital or derivative markets. These positions reflect their views on overall market direction as influenced by major economic trends or events. The portfolios of these funds can include stocks, bonds, currencies, and commodities in the form of cash or derivatives instruments. Most funds invest globally in both developed and emerging markets.
Managed Futures
This strategy invests in listed financial and commodity futures markets and currency markets around the world. The managers are usually referred to as Commodity Trading Advisors, or CTAs. Trading disciplines are generally systematic or discretionary. Systematic traders tend to use price and market specific information (often technical) to make trading decisions, while discretionary managers use a judgment approach.
Dedicated Short Bias
Dedicated short sellers were once a robust category of hedge funds before the long bull market rendered the strategy difficult to implement. A new category, short biased, has emerged. The strategy is to maintain net short as opposed to pure short exposure. Short biased managers take short positions in mostly equities and derivatives. The short bias of a manager’s portfolio must be constantly greater than zero to be classified in this category.
ENDNOTES
1 Available at https://papers.ssrn.com/sol3/papers.cfm?abstract_id=252810
2 Preqin is a provider of data and intelligence for the alternative assets industry
3 Data for 2015 and 2016 was not available when I processed the data
4 Mathematically, the alphas are statistically significant; see Table (1) column 5 “t-stat (alpha)”
5 Survivorship Bias occurs when calculations only include data that relates to current funds. Hence, funds that dissolved or went bankrupt are excluded from study, resulting in an artificially high estimate of alpha.
6 Mathematically, I ran a regression of monthly hedge fund returns on the S&P 500 returns with lagged betas of one, two, and three months; see Regression 2
7 Mathematically, I reject the null hypothesis that the sum of the lagged betas is zero for the above-mentioned styles
8 poor performers” refers to hedge fund styles for which beta changes dramatically when including lags. Another way to look at it is styles for which the ratio “beta0/sum all betas” (column 8 in Table 2) differs significantly from 1
9 “good performers” refers to hedge fund styles for which beta changes mildly when including lags. Another way to look at it is styles for which the ratio “beta0/sum all betas” (column 8 in Table 2) is close to 0.6
10 “top performers” refers to hedge fund styles for which beta changes insignificantly when including lags. Another way to look at it is styles for which the ratio “beta0/sum all betas” (column 8 in Table 2) is close to 0.8-1
11 Available at https://www.preqin.com/item/2017-Preqin-Global-Alternatives-Reports/0/16501
12 See the Wall Street Journal at http://online.wsj.com/mdc/public/page/2_3021-peyield.html?mod=topnav_2_3002
13 See Outlook from Investment Strategy Group of Goldman Sachs at http://www.goldmansachs.com/what-we-do/investment-management/private-wealth-management/intellectual-capital/isg-outlook-2017.pdfbeta
This post comes to us from Pierre-Axel Gide, a master of financial economics (MFE) student at the University of Western Ontario. It is based on his recent paper, “’The New, Patient, Focused Intelligent Investor’: Dividends, Hedge Funds, and Active VS Passive Investing,” available here.