 Sky Blog

Publications like Bloomberg, The Financial Times, and The Wall Street Journal[1] have recently reported that current stock markets and especially those in the United States are more overvalued than ever. In an interview with the Financial Post[2], David Rosenberg, chief economist and strategist at Gluskin Sheff + Associates Inc., added that U.S. stocks are “supremely overvalued.” This suggests that a period of gloom might be closer than anticipated. There is, in fact, good reason for investors to be concerned. In terms of price earnings ratios[3], the S&P 500 Index has been trading at an all-time high:
Figure 1:
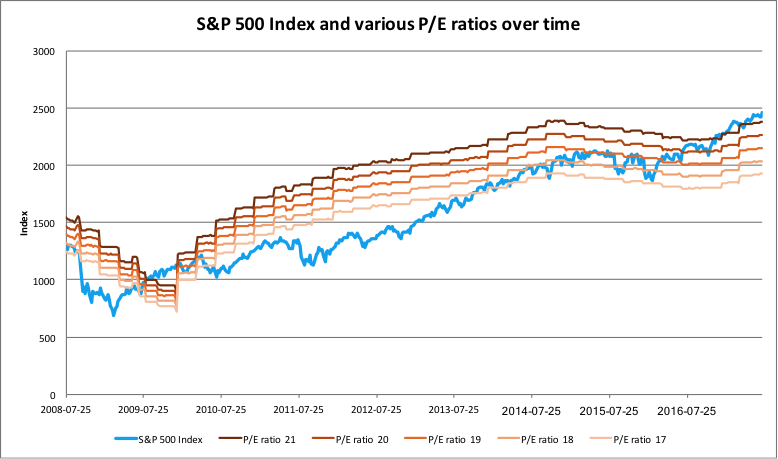
Since mid-2008, the average of price-to-earnings ratios (P/E ratios) of companies in the S&P 500 Index has climbed steadily and is currently above 21.
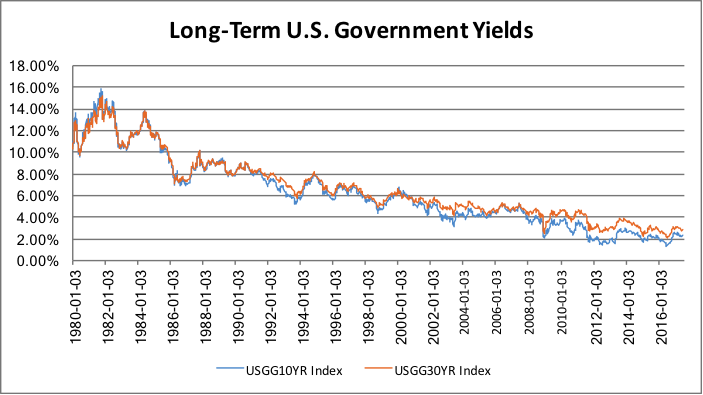
However, the situation is not as bad as it looks when investors put these valuation measures into context. First, since the 2008 global financial crisis, the Federal Reserve has injected trillions of dollars into the financial system, thus quadrupling the size of its balance sheet[4]. This massive inflow of money helped stabilize the financial system and subsequently led to recovery. As the financial situation improved, the Federal Reserve’s actions gradually encouraged investors to “chase the yield,” meaning that investors had to hold increasingly risky bonds to maintain the return on invested capital. Typically, these are bonds that take longer to mature, have a lower credit quality or weaker covenants, or are of higher duration[5]. This is why U.S. Government 10 and 30 year bonds currently yield 2.3 percent and 2.8 percent, respectively. These levels are historically low, as Figure 2 shows:
Figure 2:
Given those low returns, investors have increasingly purchased equities and propelled the S&P 500 Index into an eight-year bull cycle.
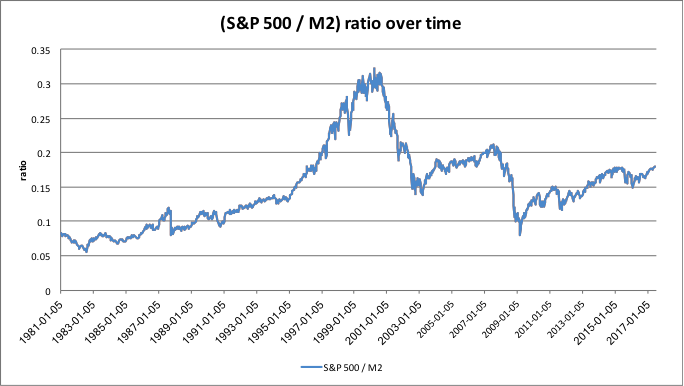
Still, this run may not yet be over. Two indicators suggest that stock markets are not overvalued. The first is the S&P 500 Index to M2 ratio[6]. This measure represents the relative importance of the S&P 500 Index to the money supply. One can easily observe that today’s level is a far cry from that seen in the 1990s and early 2000s.
Figure 3:
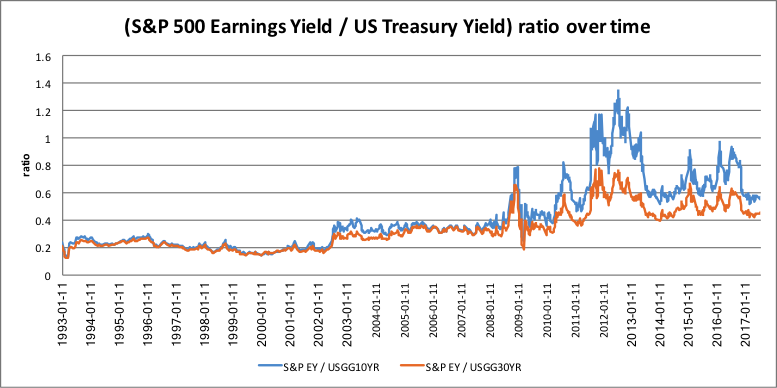
The second indicator relates to an often ignored ratio, the one comparing the S&P 500 Index earnings yield to that of long-term U.S. Government bonds (10 and 30 years). Indeed, over the last eight years, stocks (compared with bonds) have provided investors with higher earning yields than government bonds. See Figure 4 below:
Figure 4:
In addition, stocks are more expensive today because they simply provide a higher return for investors, even after accounting for the inherent risk premium: From 2009 to 2017, the S&P 500 has returned a geometric average of 12.6 percent[7]. If we subtract the 4 percent[8] return for long-term bond yields, investors are left with an 8.6 percent excess return, which is higher than the suggested 6 percent[9] excess return versus bond yields under the traditional theory of equity premium puzzle[10].
In any event, the alternatives are less than enticing. Cash, for example, yields nothing (or very little, so it is not suitable for a retirement plan) and creates the opportunity cost of missing out on further market gains. As for bonds, Blackrock’s Global Investment Outlook Midyear 2017[11], warns that “low government bond yields are likely here to stay.” Alternative investments through private equity firms or hedge funds offer potentially high returns, but they mostly cater to institutional investors or accredited, high-net-worth individuals. Then there are managed futures, commodities, and real estate. The Wisdom Tree Managed Futures Strategy ETF has declined 20.77 percent since inception[12], commodity indices have still not regained their 2007 levels[13], and investors already exposed to real estate (typically through condominium or home ownership) would only be concentrating risk rather than diversifying.
It’s true that, overall, stocks are more expensive today than ever before. However, the money stock (M2), stock yields, long-term bond yields and recent earnings make current share valuations seem reasonable. Additionally, stocks (typically held through ETFs or index funds) remain the most cost-effective investment for investors. Finally, if stocks were cheap, investors would have already bought them up and pocketed the easy money. When it comes to investing, there is a big difference between expensive and overvalued.
ENDNOTES
[1] See https://www.bloomberg.com/news/articles/2017-06-13/looking-for-world-s-most-inflated-investments-check-u-s-stocks; https://www.ft.com/content/62960bce-0fe4-11e7-b030-768954394623; https://www.wsj.com/articles/how-overvalued-markets-translate-into-lower-returns-1405099363.
[2] See http://business.financialpost.com/investing/trading-desk/david-rosenberg-thinks-stocks-are-supremely-overvalued/wcm/f20499c9-e17f-45ea-a27d-948e3a36b9b1.
[3] The P/E ratio, also called “price-to-earnings ratio,” measures the current share price to the earnings per-share (EPS). See https://www.cfainstitute.org/learning/tools/glossary/Pages/index.aspx?SelectedLetter=J and https://www.cfainstitute.org/learning/tools/glossary/Pages/index.aspx?SelectedLetter=P.
[4] See https://www.federalreserve.gov/monetarypolicy/bst_recenttrends.htm.
[5] “Duration” measures a bond’s price sensitivity to interest rate movements.
See https://www.cfainstitute.org/learning/tools/glossary/Pages/index.aspx?SelectedLetter=D.
[6] See https://fred.stlouisfed.org/series/M2.
[7] See http://pages.stern.nyu.edu/~adamodar/New_Home_Page/datafile/histretSP.html.
[8] Over the period 2009-2017, long-term bond yields were for the most part below 4 percent (see Figure 2).
[9] See http://faculty.econ.ucdavis.edu/faculty/kdsalyer/LECTURES/Ecn200e/mehra-prescott.pdf.
[10] The equity premium puzzle refers to the empirical observation that stocks have consistently outperformed bonds over the last century by a significant margin (typically 6 percent). Most academics explain this puzzle with two theories: high loss aversion (investors are more sensitive to losses than to gains) and a need to frequently monitor one’s wealth (frequent monitoring leads to frequent losses and thus, investors are less willing to accept risk). See http://www.nyu.edu/econ/user/bisina/benartzi_thaler.pdf.
[11] See https://www.blackrock.com/corporate/en-us/literature/whitepaper/bii-global-investment-outlook-midyear-2017-us.pdf.
[12] See https://www.wisdomtree.com/etfs/alternative/wdti.
[13] See https://www.ubs.com/global/en/investment-bank/bloomberg-cmci/factsheets.html.
This post comes to us from Pierre-Axel Gide, a master of financial economics (MFE) student at the University of Western Ontario.