The January 2023 report ESG Performance and Enterprise Value: Do Firms with Stronger ESG Performance Have Higher Valuation Ratios? investigated the relationship between the ISS ESG Performance Score (a normalized version of the ISS ESG Corporate Rating) and two valuation ratios from the ISS Economic Value Added (EVA) framework.
This report was followed by a supplementary study in May 2023, “ESG Performance and Enterprise Value: In Which Sectors Does ESG Performance Matter the Most for Company Valuation?,” which dove deeper into this relationship from a sector-specific standpoint.
Continuing the ESG Performance and Enterprise Value series, this post applies regression analysis to a global sample of companies over a five-year period (June 2017 to June 2022), in order to explore the relationship from a regional perspective. (Descriptive statistics for different regions are available in Appendix B, panel D, of the first study.) The post provides a comparative analysis of the five regions through the lens of box plots, examining ESG Performance scores, Market Value Added (MVA) Spread, and Future Growth Reliance (FGR).
After controlling for company size, profitability, balance sheet strength, industry, country of domicile, and calendar quarter, the relationship between ESG Performance and company valuation is generally either “positive and significant” or “positive and insignificant”; which category the relationship falls into varies across regions. The analysis indicates that ESG Performance is positively and significantly correlated with MVA Spread in North America and Europe. It also indicates that ESG Performance is positively and significantly correlated with FGR in Asia, North America, and Europe.
Relative Distribution of ESG Performance and MVA Spread across the Five Regions
The box plot presented below depicts the distribution of ESG scores across five regions (Figure 1). The analysis reveals that among companies falling between the 25th and 75th percentiles, those in Europe exhibit the highest ESG scores; the median score for European companies is notably higher than for companies in the other four regions.
Figure 1: ESG Performance Score by Region
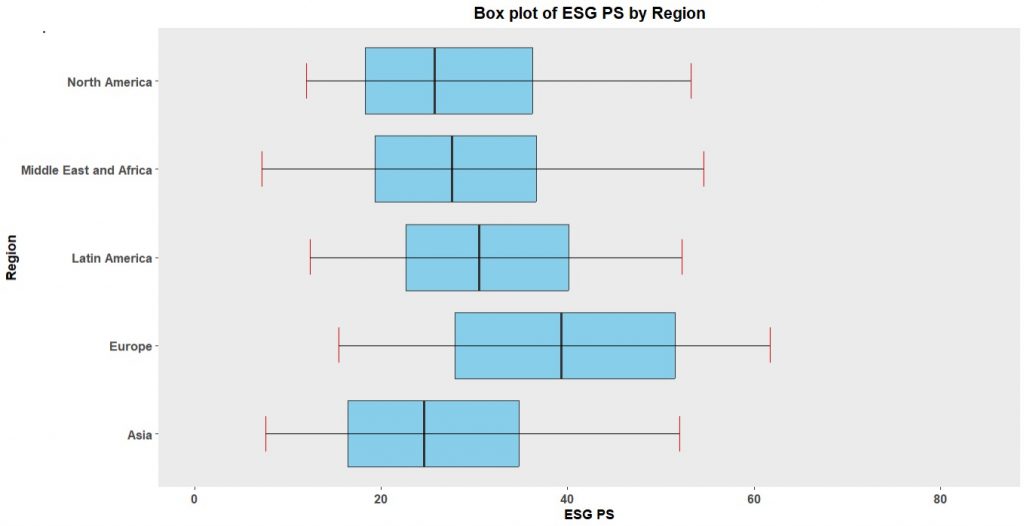
Notes: The range of values is bounded between the 5th and 95th percentiles, represented by the whiskers. The lower and upper edges of the boxes correspond to the 25th and 75th percentiles, respectively. The lines inside the boxes represent the median, signifying the values that divide the lower 50% of the data from the upper 50%.
Source: ISS ESG
The second region with the highest ESG score within the 25th-75th range is Latin America, followed closely by Middle East and Africa, North America, and Asia. Moreover, Europe displays a relatively elongated box, indicating that the ESG scores are more widely dispersed within this range. Last, Europe is also home to companies with the highest ESG scores, with some companies surpassing a score of 60. This finding sheds light on the region’s strong performance in ESG practices compared to other regions.
The box plot of the distribution of Market Value Added (MVA) Spread by region (Figure 2) indicates that the median is around the same value across the five regions, with only a slight advantage in North America. Notably, North America displays a larger box, particularly between the median and the 75th percentile.
Figure 2: MVA Spread by Region
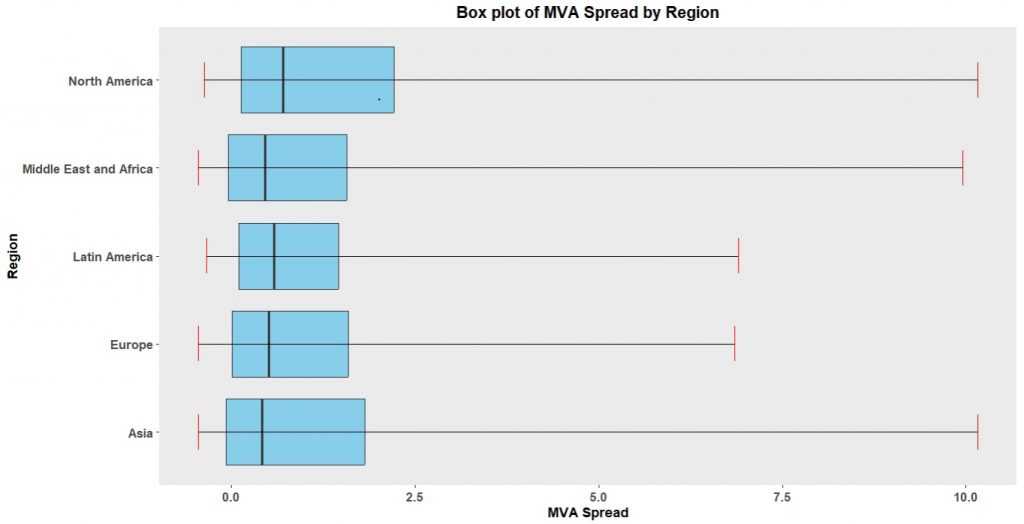
Notes: The range of values is bounded between the 5th and 95th percentiles, represented by the whiskers. The lower and upper edges of the boxes correspond to the 25th and 75th percentiles, respectively. The lines inside the boxes represent the median, signifying the values that divide the lower 50% of the data from the upper 50%.
Source: ISS EVA
MVA Spread varies considerably beyond the 75th percentile, especially for North America, Asia, and Middle East and Africa (with values exceeding 10.0). Europe and Latin America show a lesser, though still relevant, variation in MVA Spread beyond the 75th percentile (around 7.0).
These findings suggest that while the median MVA Spread is relatively consistent across regions, North America, Middle East and Africa, and Asia exhibit a more substantial dispersion of MVA spread, particularly in the upper range. This indicates that some companies in these regions are experiencing significantly higher economic performance compared to others, resulting in a wider distribution of MVA Spread.
In Which Region Does Stronger ESG Performance Translate into Greater Valuation?
The Market Value Added (MVA) Spread from the ISS EVA framework serves to assess company valuation. This metric corresponds to the difference between a company’s Enterprise Value and its Capital, scaled by its Capital. MVA can be understood as the Price-to-Book ratio; however, the book value has been refined to account for economic adjustments.
In the ISS EVA framework, Capital is defined as all assets used in business operations, net of trade funding from accounts payable and accrued expenses and after adjusting for accounting distortions. For instance, Capital is measured net of excess cash, net of deferred tax assets, and net of pension and retirement assets, but including leased assets, and after capitalizing and amortizing research and development (R&D) and advertising spending over time.
ESG performance is still measured using the ISS ESG Performance Score, a normalized version of the ISS ESG Corporate Rating that considers the magnitude of an industry’s exposure to ESG risks and opportunities, as well as its overall footprint along the value chain. This metric ranges from 0 to 100. (More information about key variables and the sample composition can be found in the Appendix of the first study.)
Like the sector-based study, this post provides regression coefficients that indicate the relationship strength between ESG performance and MVA Spread across several regions. The post also delves into estimated effects of ESG performance on Enterprise Value within each region, again using regression models.
Figure 3 presents the estimated effects of the ESG Performance Score on the MVA Spread across five distinct regions. The relationship between ESG Performance and MVA Spread demonstrates a positive and significant correlation at the 10% level for North America and Europe. When all companies were examined together in the first study, the regression coefficient on ESG Performance Score was positive and statistically significant, being equal to 0.01. In this case, the relationship is stronger (i.e., the regression coefficient is larger than 0.01) in the North America region.
Figure 3: Estimated Effects of ESG Performance Score on MVA Spread (Regression Coefficients) for Different Regions
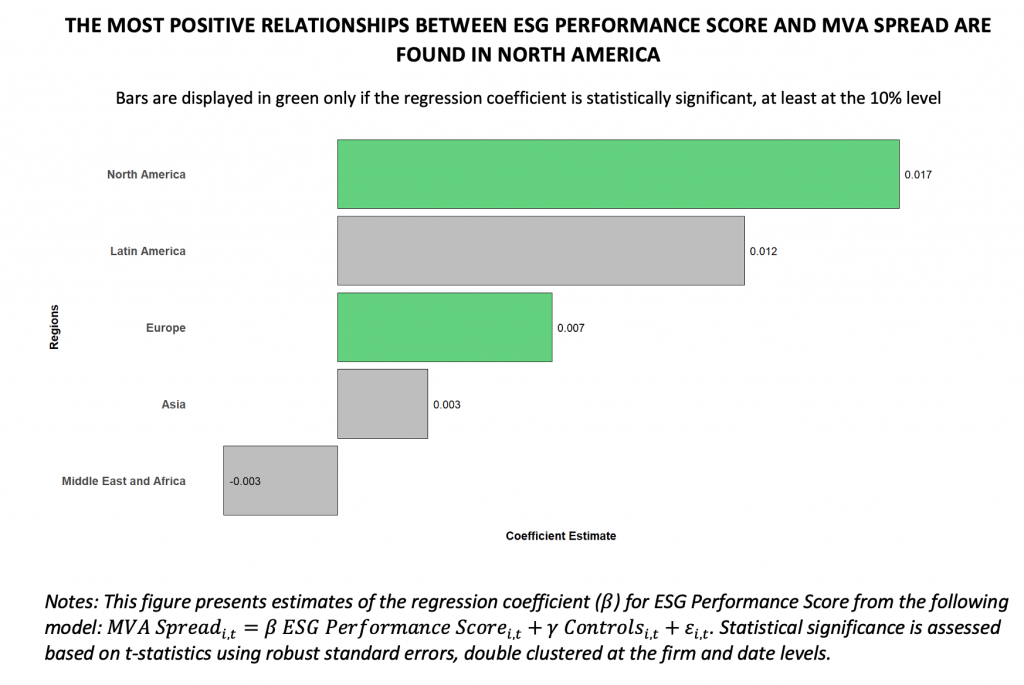
Sources: ISS ESG Corporate Rating and ISS EVA
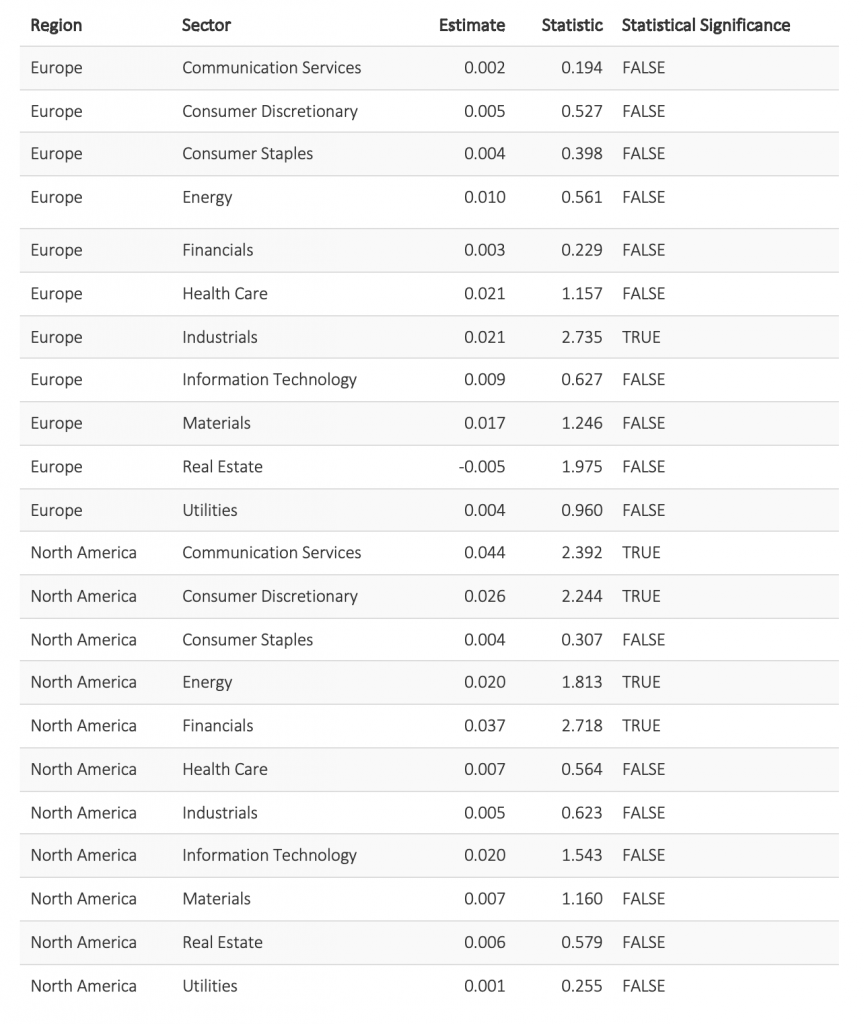
Table 2 in the Appendix shows that four sectors in the North America region are positive and significant at the 10% level: Communication Services, Financials, Consumer Discretionary, and Energy. In the May 2023 study, when all companies within a sector, both in North America and Europe, were measured together, these four sectors were also found to be positive and significant. Specifically, the regression coefficient for the Communication Services sector was 0.024. However, when only North American companies were assessed within that sector, the regression coefficient increased to 0.044. In contrast, in Europe, only the Industrials sector showed a positive and significant relationship at the 10% level. This finding aligns with the results presented in Figure 3, which demonstrates a stronger overall relationship in North America compared to Europe.
What Does This Mean in Terms of Enterprise Value?
While MVA Spread is a powerful tool, thinking directly in terms of Enterprise Value is sometimes easier. MVA Spread is defined as the difference between Enterprise Value and Capital, divided by Capital. Conversely, Enterprise Value corresponds to the product of MVA Spread and Capital, plus Capital.
In North America, the median MVA Spread is 0.71 and the median capital is $2.84 billion. Plugging these figures together into the Enterprise Value Equation gives an estimate of $4.86 billion (= 0.71 x $2.84 billion + $2.84 billion).
The regression model predicts that a company in North America with an ESG Performance Score 10 points higher than a comparable company would have an MVA Spread 0.17 higher than that of its peer (=0.017 x 10). Assuming a peer with a median MVA Spread (= 0.71), the company with the higher ESG performance would have an MVA Spread of 0.88 (= 0.71 + 0.17).
Plugging the MVA Spread of this company into the Enterprise Value Equation provides an estimate of $5.34 billion (= 0.88 x $2.84 billion + $2.84 billion). This estimate is 10% higher than the one obtained for the company with the median MVA Spread of 0.71, suggesting that the relationship between ESG Performance and Enterprise Value is not only statistically significant but also economically meaningful.
Table 1: Estimated Differences in Enterprise Values for the 5 Regions with 10-Point-Higher ESG Performance Scores
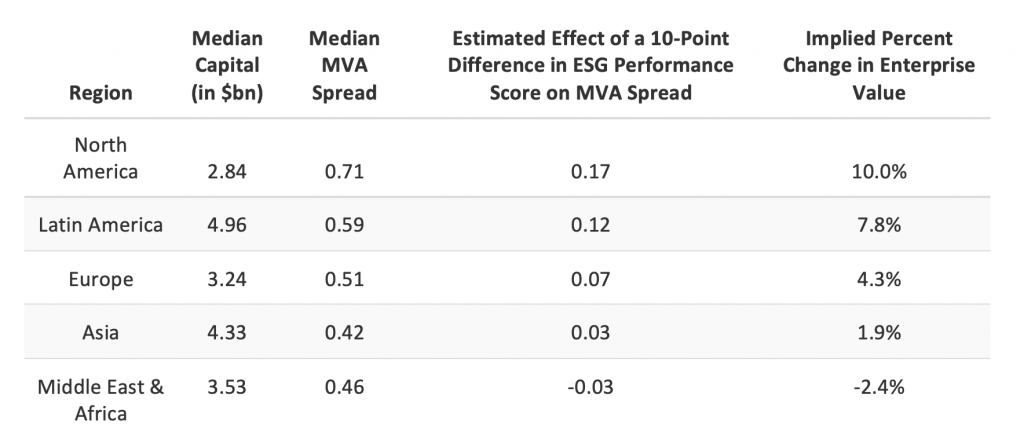
Source: ISS EVA
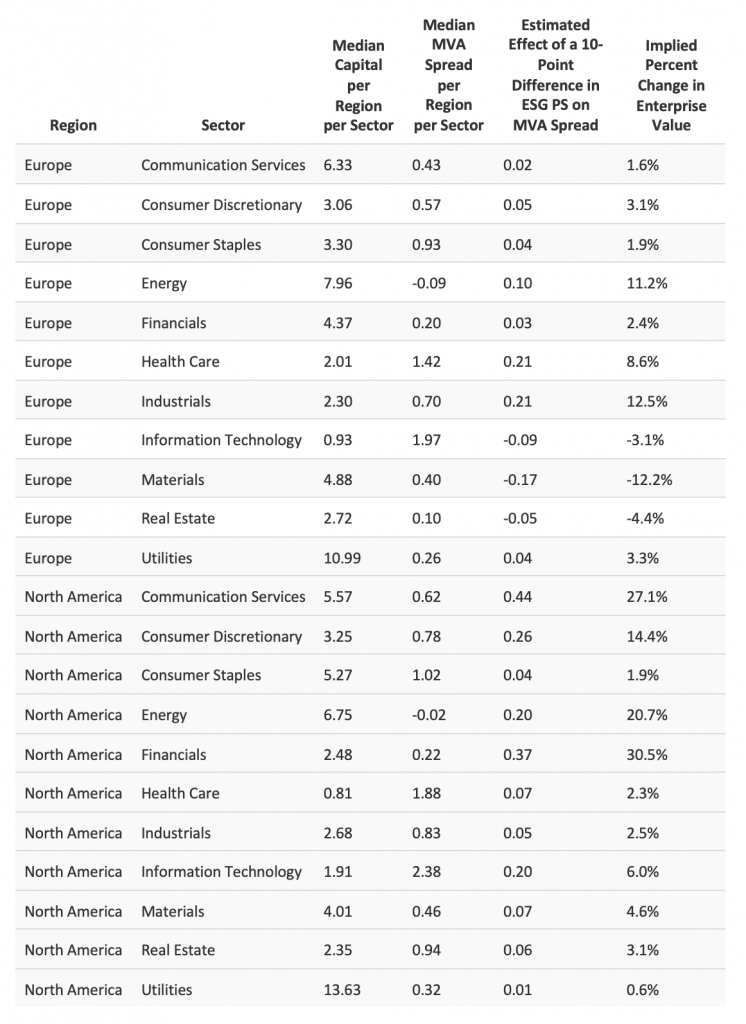
Table 3 in the Appendix provides a comprehensive analysis, incorporating sector-level information, for North America and Europe. In North America, all sectors exhibit a positive implied percent change in Enterprise Value, with the highest percentages observed in the Financials, Communication Services, and Energy sectors.
Following the same process as above, a North American company operating within the Financials sector would result in an estimate of $3.94 billion (= 0.59 x $2.48 billion + $2.48 billion). This estimate is 30.5% higher than the one obtained for the company with the median MVA Spread of 0.22 (= $3.02 billion). Meanwhile in Europe, the Industrials and Energy sectors stand out with the highest implied percent changes in Enterprise Value, at 12.5% and 11.2%, respectively. Intriguingly, three out of the 11 sectors exhibit a negative percentage (Materials, Information Technology, and Real Estate).
Zooming in on Growth Expectations
Another important tool in the ISS EVA framework is called Future Growth Reliance (FGR). It represents the percentage of Enterprise Value that is dependent on future growth in EVA: FGR quantifies the portion of the company’s Market Value that is associated with investor’s expectations for future growth.
Figure 4 provides a box plot for the FGR across the five regions. The median value is approximately consistent across all regions, except for Middle East and Africa, which displays a slightly lower median value, although it is still greater than 0. Interestingly, we observe that the values are more widely spread within the first quartile compared to the fourth quartile.
Figure 4: FGR by Region
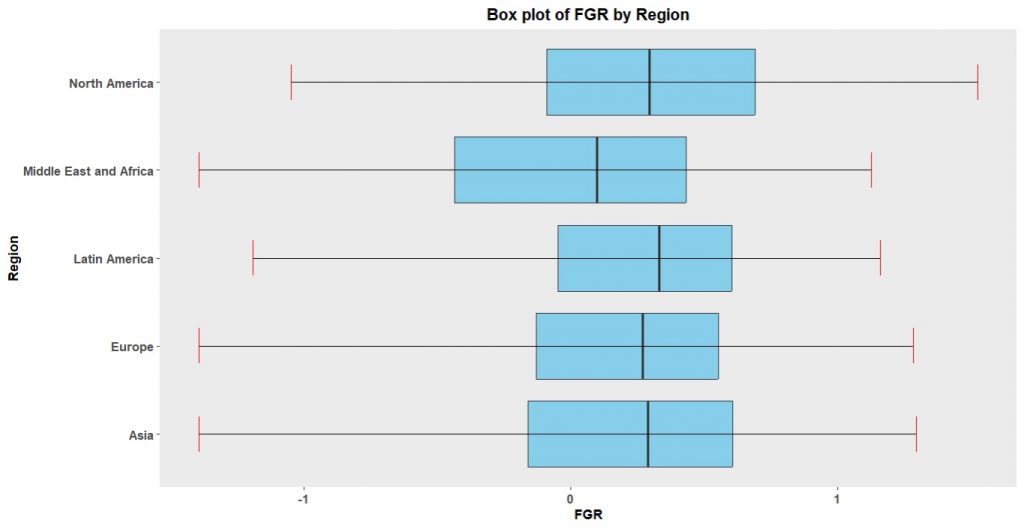
Notes: The range of values is bounded between the 5th and 95th percentiles, represented by the whiskers. The lower and upper edges of the boxes correspond to the 25th and 75th percentiles, respectively. The lines inside the boxes represent the median, signifying the values that divide the lower 50% of the data from the upper 50%.
Source: ISS EVA
North America stands out as the region with the highest FGR value at the 95th percentile level. This region is also the one where companies have the negative values closest to zero at the 5th percentile level. A negative FGR value means that investors are expecting a loss of profitability from current levels.
The findings in Figure 4 indicate that most companies in all regions have a positive FGR, aligning with investors’ expectations for future growth. However, North America seems to have a higher concentration of companies with exceptionally positive FGR values, which may reflect a more optimistic outlook for future growth prospects in this region.
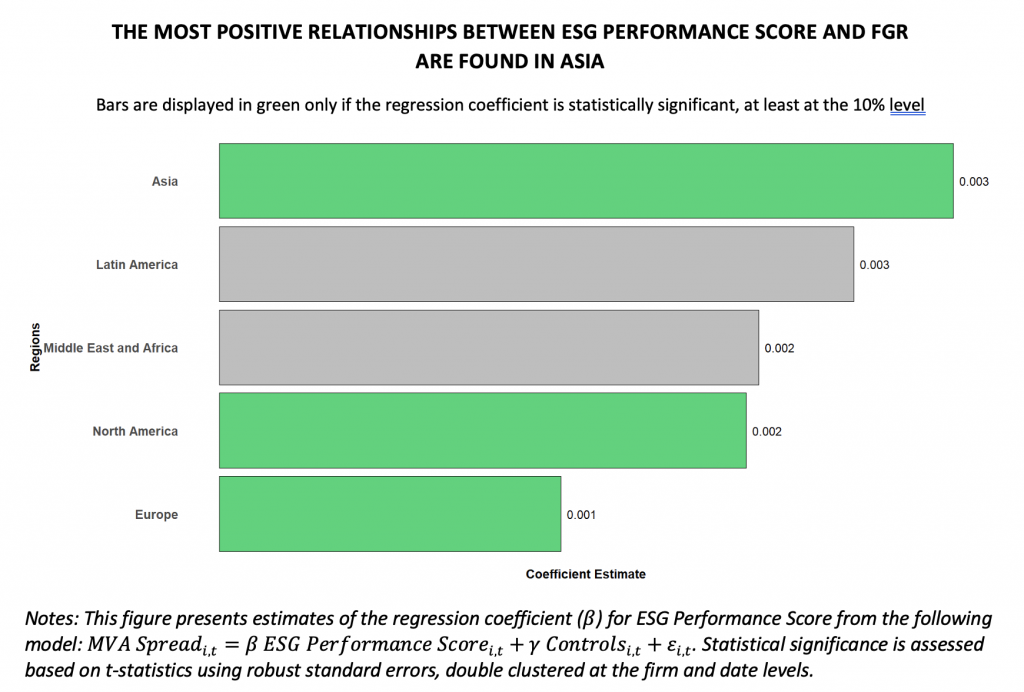
Figure 5 shows the estimated effects of ESG Performance Score on FGR for the five regions. The regression model includes the same control variables as those described in Figure 3.
Figure 5: Estimated Effects of ESG Performance Score on FGR (Regression Coefficients) for Different Regions
Sources: ISS ESG Corporate Rating and ISS EVA
Like MVA Spread, the relationship between ESG performance and FGR is positive and significant in North America and Europe. However, this relationship also becomes significant in Asia, which exhibits the greatest coefficient. These significant relationships suggest that the higher valuations (higher MVA Spreads) achieved by high-ESG-scoring companies in these regions could be partly driven by higher investor expectations for future growth.
Limitations
This study supports the hypothesis of a positive relationship between ESG Performance and Enterprise Value. However, both ESG Performance and Enterprise Value can be influenced by a wide array of factors. Although several control variables were included in the regression models, there may be other confounding factors that were not considered in the analysis. Additionally, the results are specific to the 2017-2022 period and cannot be extrapolated into the future.
Conclusions
The first study in this research series suggested that a company’s ISS ESG Corporate Rating could help explain an additional level of premium or discount to contemporary ISS EVA-centric valuation ratios. The second study identified the relationship for different sectors. This third study shows in which regions these relationships are the strongest.
Appendix
Appendix 1
Table 2: Estimated Differences in Enterprise Values for 11 Sectors in Europe and North America with 10-Point-Higher ESG Performance Scores
Source: ISS ESG Corporate Rating and ISS EVA
Appendix 2
Table 3: Estimated Differences in Enterprise Values for 11 Sectors in North America and Europe with 10-Point-Higher ESG Performance Scores
Source: ISS ESG Corporate Rating and ISS EVA
This post comes to us from Institutional Shareholder Services. It is based on the firm’s article, “ESG Performance and Enterprise Value: In Which Region Does ESG Performance Matter the Most for Company Valuation?” dated October 31, 2023, and available here.
 Sky Blog