 Sky Blog


Around the time Tesla’s board granted CEO Elon Musk a massive 10-year, $2.3 billion equity award, a small number of companies offered similar “mega grants” to their CEOs. The outcome of Musk’s grant is known, but the outcomes of these other awards have been less thoroughly analyzed.
We studied the payout of these grants using a sample of equity awards valued at $100 million or more between 2016 to 2022. Our sample includes 28 unique CEOs, who received 40 equity instruments (see Figure 1 and Figure 2).[1]
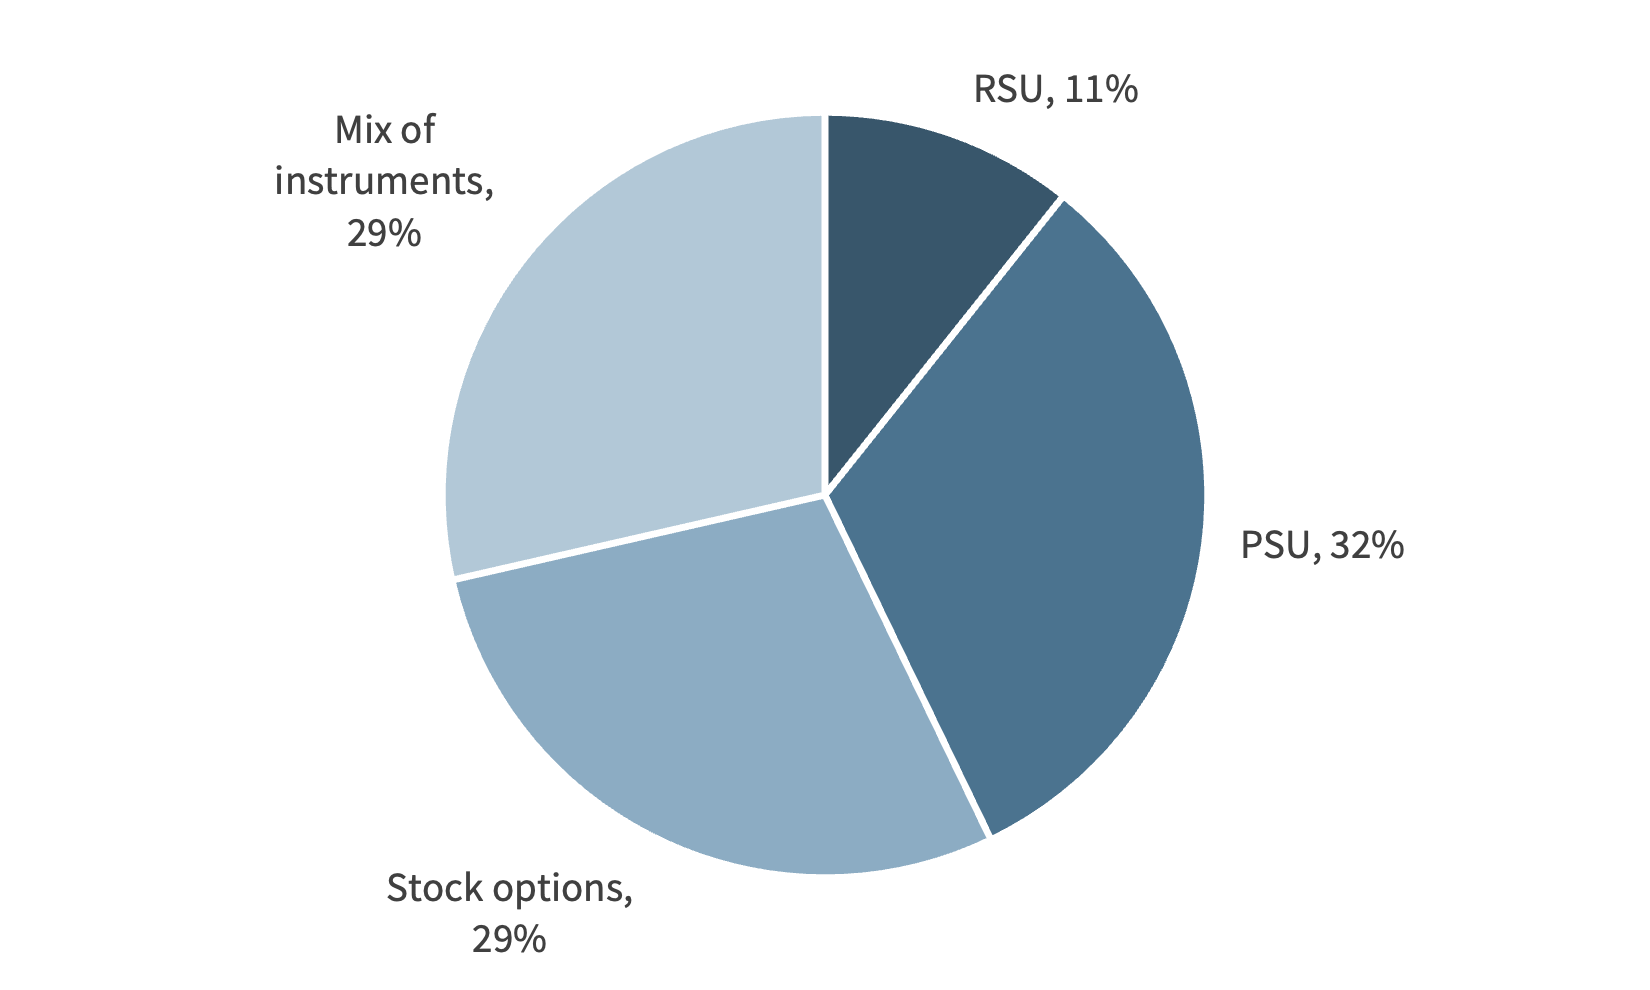
Figure 1. Mega Grants, by CEO.
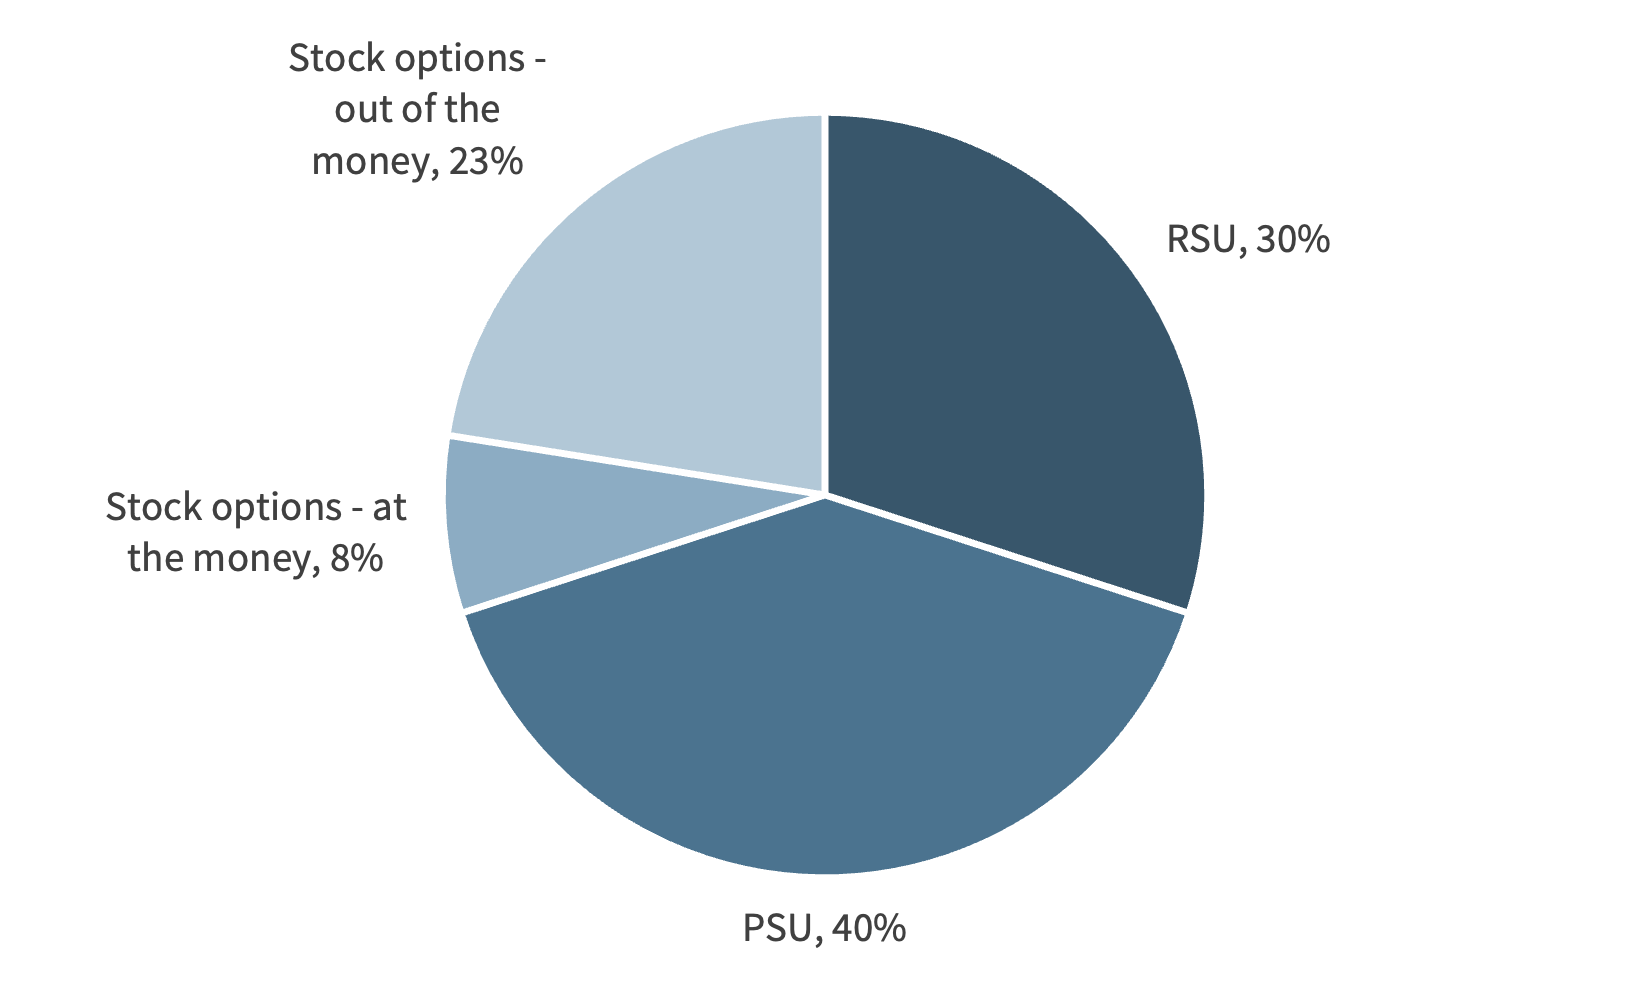
Figure 2. Mega Grants, by Award Type
The expected value of these awards ranged from $109 million to $1.09 billion (median $211 million, mean $287 million), and the vesting period from three years to 10 years (median five years, average 5.9 years).
63 percent of awards in our sample include a performance-based trigger. These triggers generally require extremely aggressive stock price and operating performance, encouraging “swing for the fence” outcomes (see Table 1).
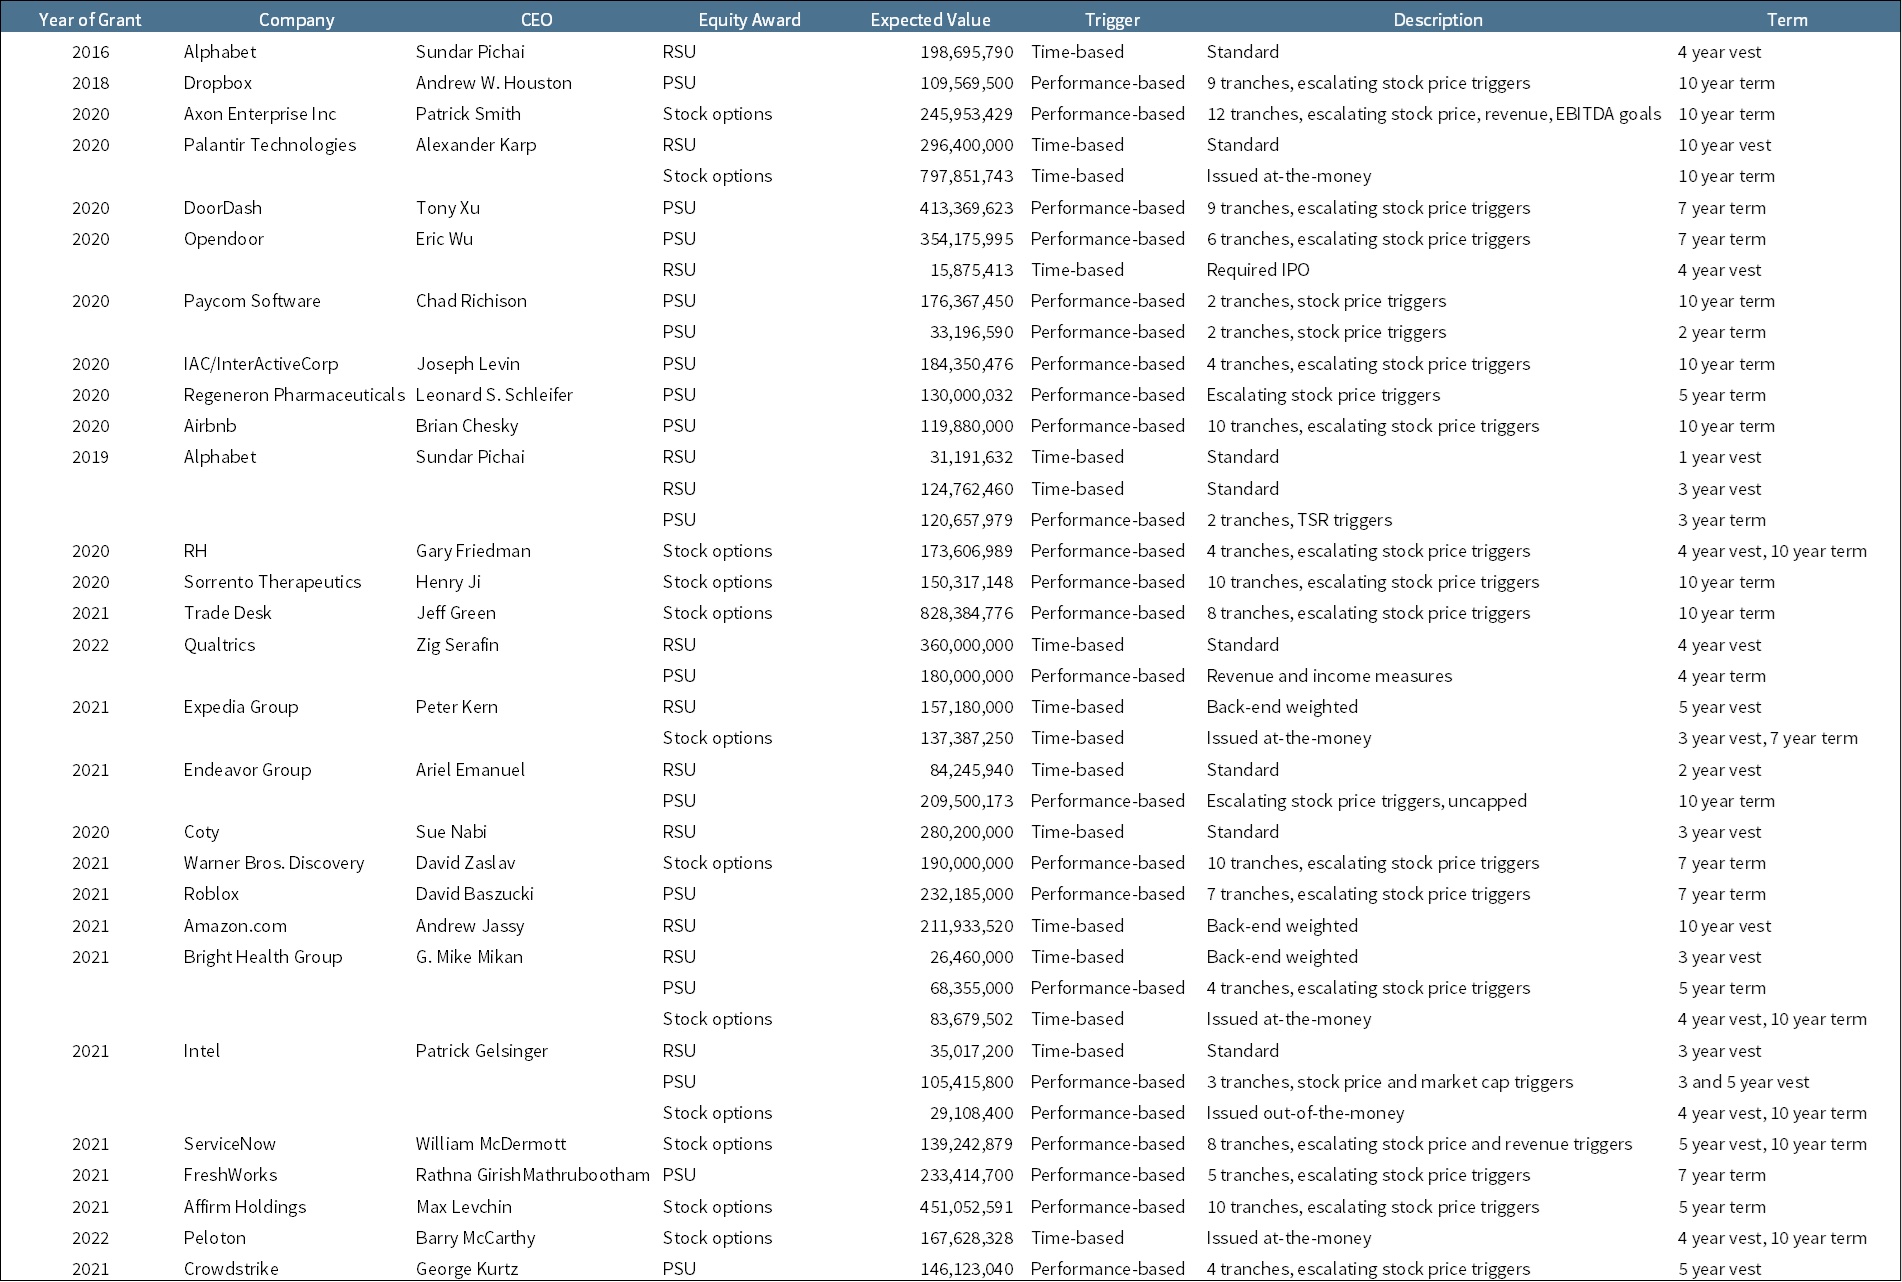
Table 1. Terms of Mega Grant Awards
AirbFor example, in 2020, Airbnb awarded its CEO performance shares consisting of 10 tranches of restricted stock (1.2 million shares per tranche, or 12 million total), with escalating stock-price triggers starting at $125 per share and increasing in $40 increments to $485. Achieving the highest threshold would require an increase in market value of Airbnb from $75 billion to $291 billion over a 10-year period.
Such escalating tranches create non-linear payoff regions. The CEO’s incentive is not smooth across performance levels; instead, incentives spike near thresholds. Economic theory suggests that behavior may cluster around these hurdles, potentially encouraging short-term actions designed to cross specific price points rather than maximize long-term firm value.
Mega Grant Ex-Post Payout
In measuring the payout values of grants, we separate those that are fully vested (complete) from those whose measurement period is not yet complete and ultimate payout not yet known (open). In our sample, 62.5 percent are complete, and 37.5 percent are still open.
We measure the “payout value” as the pre-tax realizable value at each vesting date. This value represents the value available to the CEO on the day vesting conditions are met and is therefore a fair measure of the compensation actually awarded to the CEO by the company in satisfaction of the incentives embedded in the grant program.[2]
Among the completed grants, the median (average) CEO received only 25 percent (82 percent) of expected value at issuance, which equates to $33 million (average $116 million). The outcomes for individual CEOs vary significantly. For example, the CEOs of Axon Enterprise and Regeneron received vested shares worth more than three times the originally expected value, whereas five of the 16 CEOs received zero value (see Table 2).

Table 2. Mega Grant Payout Values, Completed Grants.
Among the open grants, the median (average) CEO received 37 percent (82 percent) of expected value or $99 million (average $290 million). However, it is important to note that at least some of these awards will continue to pay out in the future, and their ultimate realizable value will be higher. One reason the open grants have a higher payout than completed grants is that the sample of completed grants includes CEOs who were terminated or whose companies failed, with their grants “closed” at termination or bankruptcy (see Table 3).
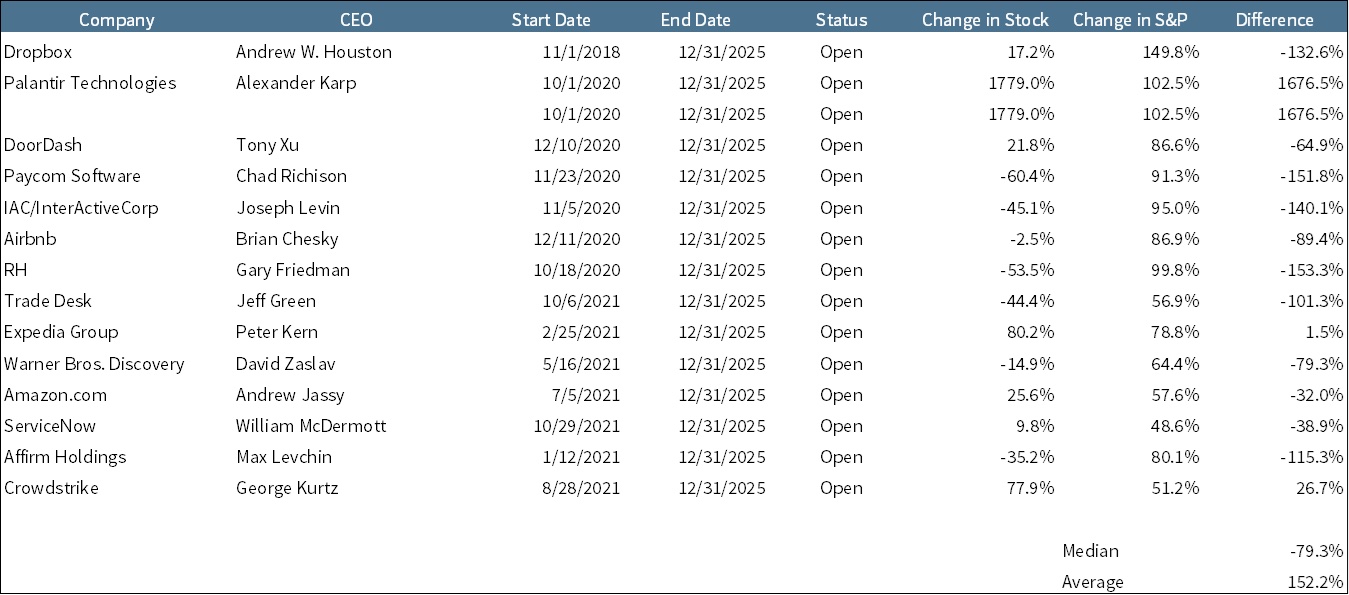
Table 3. Mega Grant Payout Values, Open Grants
Stock-Price Performance
Finally, we look at company stock performance against the market benchmark to understand how mega grant companies performed after the grant date.
For completed grants, we measure the price of the company stock between the grant date until the final vesting date. (For companies that issued grants immediately prior to IPO, we use the first trading date following IPO as the start date.) We compare this performance to the S&P 500 over the same period.
Companies with completed mega grants exhibited median performance of -27.5 percent compared with median S&P 500 performance of 32.9 percent (see Table 4).
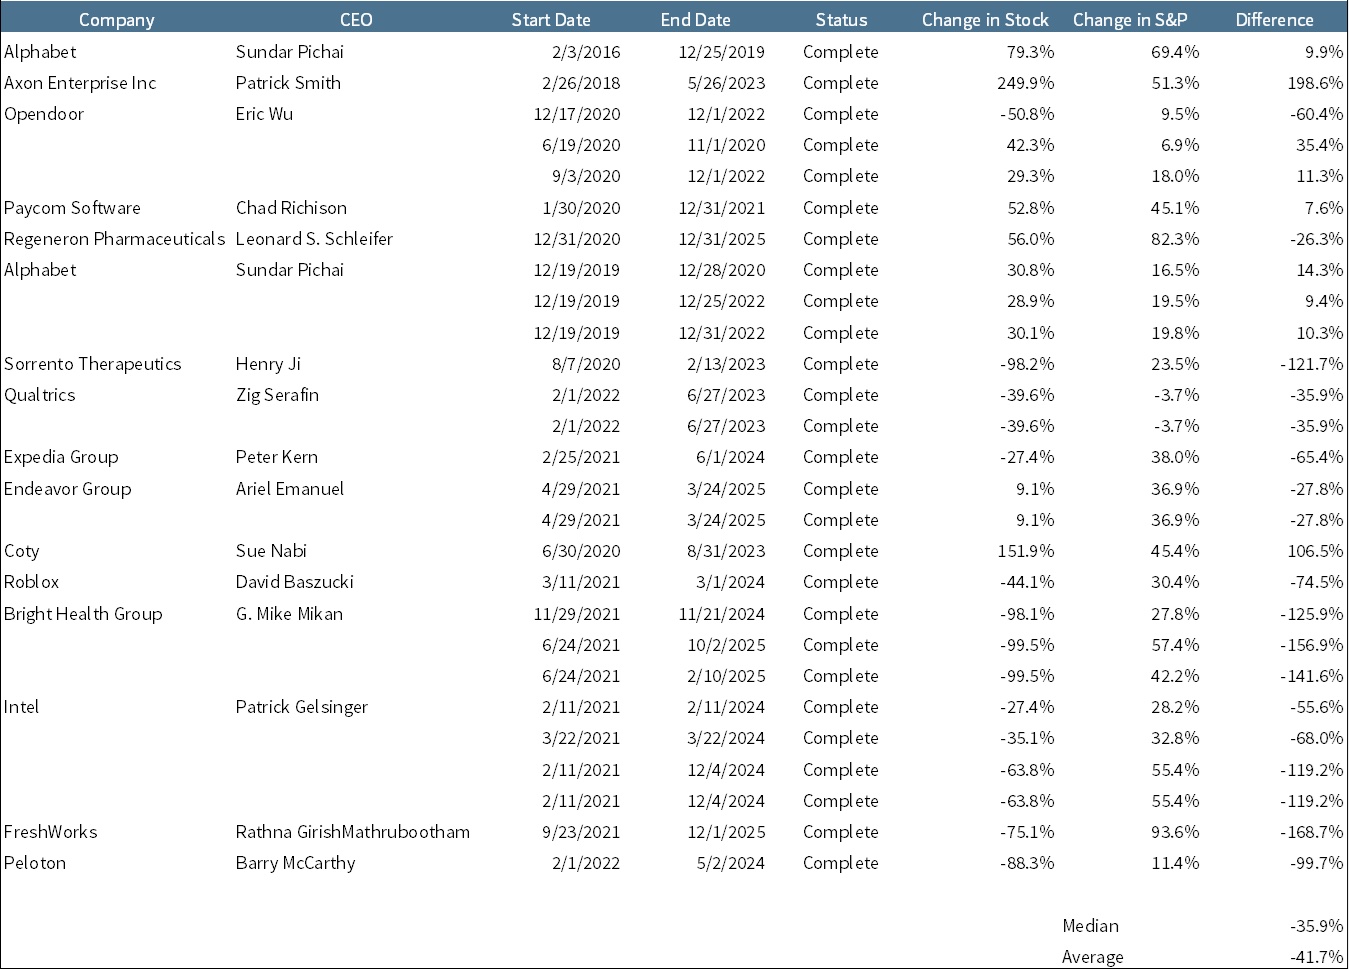
Table 4. Stock-Price Performance of Mega Grant Companies, Completed Grants
For open grants, we measure performance for both the company and the S&P 500 through December 31, 2025. This sample exhibited median company performance of 9.8 percent compared with median S&P 500 performance of 86.6 percent (see Table 5).

Table 5. Stock-Price Performance of Mega Grant Companies, Open Grants
Needless to say, many companies issuing mega grants underperformed the market. Across all companies, only 13 of the 40 mega grants (32.5 percent) corresponded with outperformance. This distribution is consistent with tournament-style incentives: a small number of large winners and a substantial number of non-payers. The question for shareholders is whether the right tail sufficiently compensates for the left tail. In portfolio terms, are mega-grant firms generating positive expected value, or are they simply increasing variance?
Similarly, only 13 of the 40 grants realized a payout higher than the originally expected amount. The average CEOs received much less than the originally expected value (in many cases, zero). Some companies’ stock prices exhibited an inverted V-shape, spiking in the months following grant date only to decline later. In these cases, the CEO might have realized a partial vesting of performance shares, with the more aggressive, higher performance targets unmet.
Conclusion
What can we conclude from these data?
First, it is evident that mega grants intended to encourage significant improvements in company performance did not, in the median case, produce substantial positive stock-price performance.
Second, and related, mega grants did not reliably produce substantial realizable compensation for the CEOs who received them. In most cases, the realizable payout to the CEO was considerably lower than expected value. That means many of the CEOs listed in media articles of the “highest paid CEOs” never actually realized their reported compensation levels.
Third, it is clear that the outcomes – both in corporate performance and in vested compensation – are highly skewed, characterized by a small number of winners among a substantial number of losers. The results are more akin to a portfolio of venture-capital investments than a broadly diversified market of established institutions.
Did the boards of these companies err in electing to award massive equity grants to their CEOs? It is exceedingly difficult to say. The boards encouraged moonshot performance. Is the failure to achieve that performance a failure of the incentive system or the expected result in a highly competitive market (perhaps a winner-take-all setting) where the average corporate outcome is negative? Certainly, if every CEO in our sample received the full payout amounts of their award, their boards would be open to criticism for setting the performance targets too low.
A final question is whether it is better to offer massive point-in-time equity awards rather than the more typical annual awards over time at multiple stock prices. Point-in-time awards might be more appropriate in situations where highly convex compensation contracts are necessary to instill managerial urgency to undertake major strategic and operational change (“winner-take-all” market situations). By contrast, annual equity awards allow the board to tailor each package – and adjust operating and stock price targets – to meet the present economic situation. This reduces risk and increases the board’s flexibility but also allows for the performance bar to be lowered following a period of stock price decline.
ENDNOTES
[1] Mega grants do not always consist of a single equity type (RSU, PSU, or stock option). In some cases, the CEO receives more than one equity type as part of the overall package. For example, in 2019, Alphabet awarded its CEO $31 million in restricted stock with a one-year vest, $125 million in restricted stock with a three-year vest, and $121 million in performance stock with a two-year measurement period (total expected value of $277 million). When a CEO received more than one equity award, we analyzed the payout and performance of each award individually.
[2] An alternative method of determining the “payout value” is to compute the value realized by the CEO. This value equals the pre-tax dollar amount realized by the CEO when the underlying shares are sold for cash. This is a more difficult computation because the dates of these actions can extend far into the future.
David F. Larcker is the James Irvine Miller Professor of Accounting, Emeritus at Stanford Graduate School of Business; Amit Seru is the Steven and Roberta Denning Professor of Finance and Senior Associate Dean for Academic Affairs at Stanford Graduate School of Business; and Brian Tayan is a researcher at Stanford Graduate School of Business. This post is based on their recent paper, “Swinging for the Fences: How Do CEO Mega Grants Pay Out for Companies and Shareholders?” available here.