 Sky Blog

In the aftermath of the financial crisis of 2008-09 there was a widespread perception that the opacity of derivatives exposures held by major financial institutions contributed to the build-up of systemic risk. As a result, the G-20 leaders convened in 2009 in Pittsburgh and decided to reform derivatives markets, with a key ingredient of these reforms being the improvement of pre-trade transparency in these markets. The essence of this particular reform was that whoever wished to trade a derivative contract should be able to more easily observe and trade at the best available price. The United States implemented this reform as part of the Dodd-Frank Act in 2013 and 2014. Two years later, the data available have allowed us to study the impact on key derivatives markets.
The interest rate swap market and its structure
A key type of contract that the derivatives reform affected is the interest rate swap (IRS)[1]. This is by far the largest financial market in existence; as of June 2015 there were about $320 trillion of notional amounts outstanding in IRS contracts.[2] Trading in swap contracts (including IRS) is facilitated by dealers (mostly major banks) who act as intermediaries between ultimate buyers and sellers. If you want to take a long or short position in a contract, you need to approach a dealer who will give you a price quote for the volume of contracts you wish to trade. Thus, contrary to exchange-based trading where all available liquidity and prices are displayed on a central order book (e.g. NYSE-traded stocks) and where ultimate end-users can interact directly with each other, swap trading is bilateral, or “Over-the Counter” (OTC) and, importantly, dealer-intermediated. In this setup, dealers profit from the price differential (the “spread”) that they charge their counterparties. Figure 1 illustrates the difference between OTC and centralized, exchange-based markets.

Figure 1: Stylized market structures. The image on the left represents an OTC market structure (e.g. swaps) and the image on the right a centralized market (e.g. equities). The blue dots represent market end-users and the red dots represent either dealers (left chart) or the exchange (right chart). Derivatives OTC markets are characterized by an inner segment of inter-dealer trading. Source: Duffie 2010.
The structure of OTC markets implies that they are inherently opaque. Shopping around for the best price involves sequentially contacting multiple dealers, a time-consuming and often expensive process. These search frictions limit competition and potentially enable dealers to engage in oligopolistic practices. The Dodd-Frank trade mandate sought to change this.
The Dodd-Frank trade mandate
The key element of the Dodd-Frank trade mandate for derivatives was the introduction of Swap Execution Facilities (SEFs). These are trading venues that effectively render the trading landscape more centralized and transparent in two ways. First, SEFs are required by law to feature an electronic order book. This in principle allows end-users to trade directly with each other by posting their own quotes. However, given the relatively small number of participants and trades in swap markets, activity on these order books may take some time to pick up. Second, and most importantly, SEFs also change the rules of dealer intermediation. If you are an end-user who wishes to trade a swap contract and you submit a request for a price quote through the SEF, this request is now automatically disseminated to at least three dealers of your choosing. The dealers then respond with their quoted prices and you can simply trade against the best offered price. SEFs thus represent a step increase in pre-trade transparency as they drastically reduce search costs and promote competition among dealers. Figure 2 illustrates this change in swap trading brought about by SEFs.
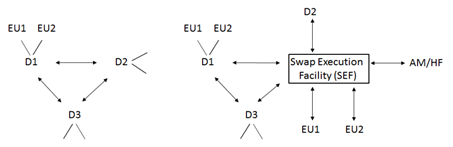
Figure 2: Post Dodd-Frank, swap trading for mandated contracts must be done on a SEF. SEFs allow market end-users (EU) such as asset managers (AM) and hedge funds (HF) to directly trade with each other. Additionally, should market end-users wish to trade with a dealer (D), they can do so in a way that enables them to compare quoted prices across a number of different dealers. The image on the left represents the pre-Dodd Frank OTC swap market structure and the image on the right represents the post-Dodd Frank structure.
The trading mandate was implemented in two phases. On October 2nd 2013 SEFs were authorized by the CFTC and SEF trading became available for the first time. Then, in February of 2014, the CFTC mandated that any US persons trading contracts of specific currencies and maturities, needed to do so via a SEF. Figure 3 shows the fraction of SEF trading in the USD and EUR segments of the plain vanilla IRS markets. Evidently, SEFs have a higher penetration in the USD segment of the market as there is a larger presence of “US persons”, who are captured by the mandate, in this segment. The phased implementation of the mandate provides an ideal testing ground for assessing the impact of the mandate on the IRS market.
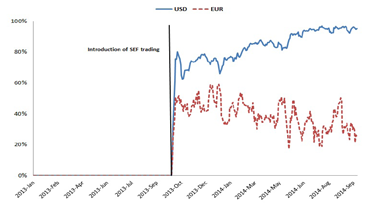
Figure 3: Fraction of SEF trading for USD and EUR denominated plain vanilla IRS contracts. The fraction of SEF trading is the volume executed on a SEF divided by the total traded volume in that currency.
Our impact study and its policy implications
In studying the impact of the trade mandate, our key performance metric is the cost of executing trades. If transparency induces competition among dealers, then end-users ought to be able to trade more cheaply. We measure execution costs mainly via the “effective spread” a metric that depends on the differences between execution prices on a given day and some daily benchmark. Larger differences suggest wider spreads and higher execution costs. The question then is what happened to execution costs as a result of the mandate. However, attributing causal effects is not easy in an analysis of this kind because a market’s effective spread may depend on a number of other factors which also change over time. To attribute causality we employ a difference-in-differences methodology. This involves comparing the effective spread of a group of contracts affected more by the mandate (the “treated group”) against an otherwise similar group which was affected less by the mandate (the “control group”).[3] To be precise, what is being compared are their effective spread changes (before vs. after) around the two implementation phases. If these two groups are otherwise similar, then any differences in their effective spreads ought to be caused by the differential effect of the trade mandate.
In our study, the treated group consists of the USD-denominated plain vanilla swap contracts that were specifically mandated by the CFTC for SEF trading. As controls we either use the non-mandated USD contracts or the mandated EUR-denominated contracts. As shown in Figure 3, the latter were less affected and had a lower fraction of SEF trading as more market participants in that segment are domiciled outside the United States.
Our key result is that execution costs dropped substantially as a result of the implementation of the trade mandate. For example, in the USD segment of the IRS market execution costs for end-users fell by about $7-$13 million daily, or by about $3-$4 million more than the EUR-mandated contracts which were less affected. We also show that contracts for which SEF usage was greatest are those which saw the largest drops in execution costs.
The evidence so far suggests that the opaqueness of swap markets had limited competition among liquidity providing dealers. The Dodd-Frank trade mandate has been a step towards fixing this problem. These results are also of profound importance for European authorities as the continent is scheduled to adopt a similar set of swap trading rules over the next few years.
ENDNOTES
[1] Interest rate swaps involve the exchange of a fixed stream of payments with a floating one. The fixed payments are calculated as a fixed fraction (the “price”) of a notional outstanding amount and the floating ones as a variable fraction of the same notional. Benchmark rates, such as the Libor, are used to determine the variable fraction.
[2] BIS Semi-annual OTC derivatives statistics.
[3] The particular terminology originates in the medical profession where this methodology is often used to assess the effectiveness of experimental drugs.
The preceding post comes to us from Evangelos Benos, at the Bank of England, Richard Payne, Professor of Finance at the City University London – Sir John Cass Business School and Michalis Vasios, at the Bank of England. The post is based on their recent paper, which is entitled “Centralized Trading, Transparency and Interest Rate Swap Market Liquidity: Evidence from the Implementation of the Dodd-Frank Act” and available here.