 Sky Blog
It is widely accepted among investors that compensation committees should align executive pay with performance in part by using incentive metrics that contribute directly to shareholder value. For this reason, it is common for incentive metrics to overlap with performance highlights relayed in press releases communicating quarterly earnings. Planting its latest performance measurement flag in the ground, Institutional Shareholder Services (ISS) introduced economic value added (EVA), contending that EVA is better than commonly used metrics such as EBITDA, EPS, and others. Compensation committees may wonder, is EVA really a better gauge of value than their earnings release metrics? Does ISS know something these boards do not?
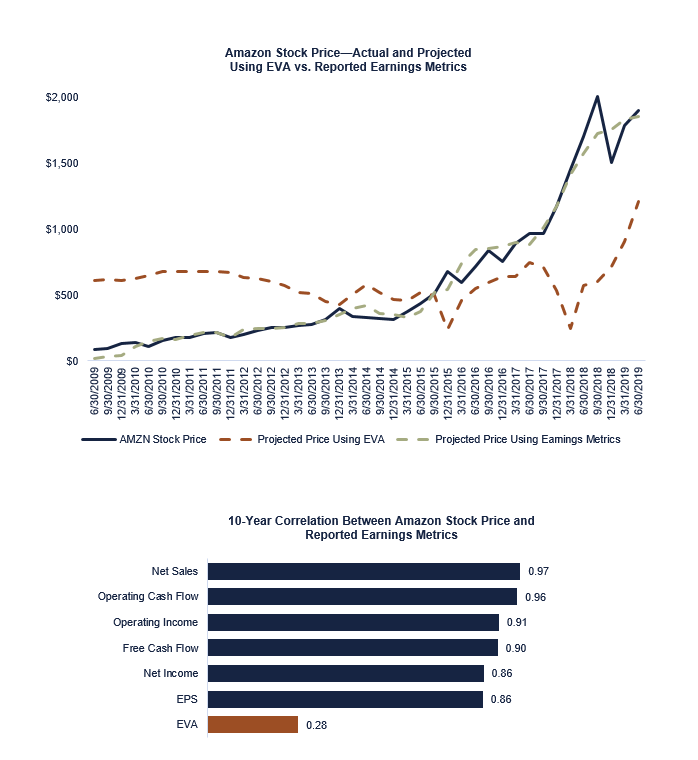
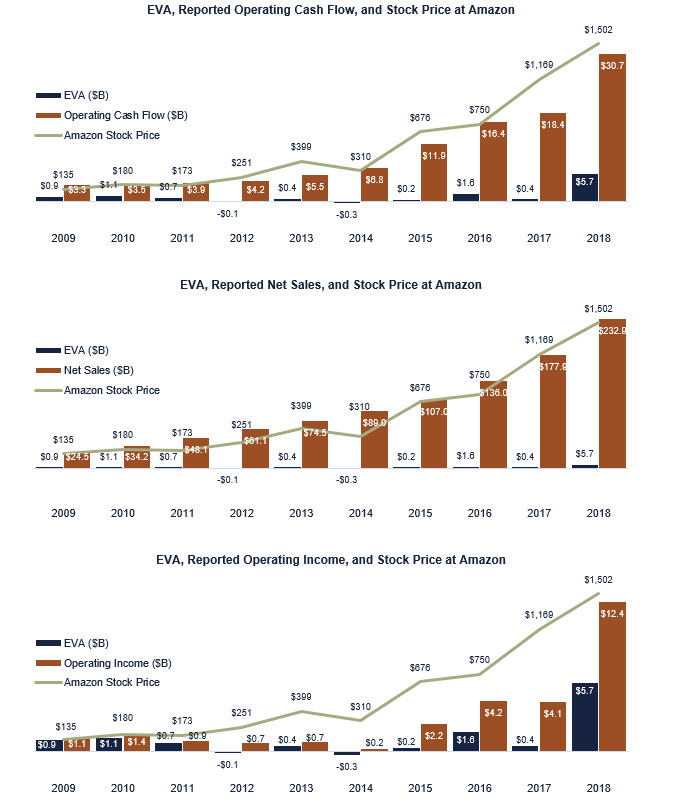
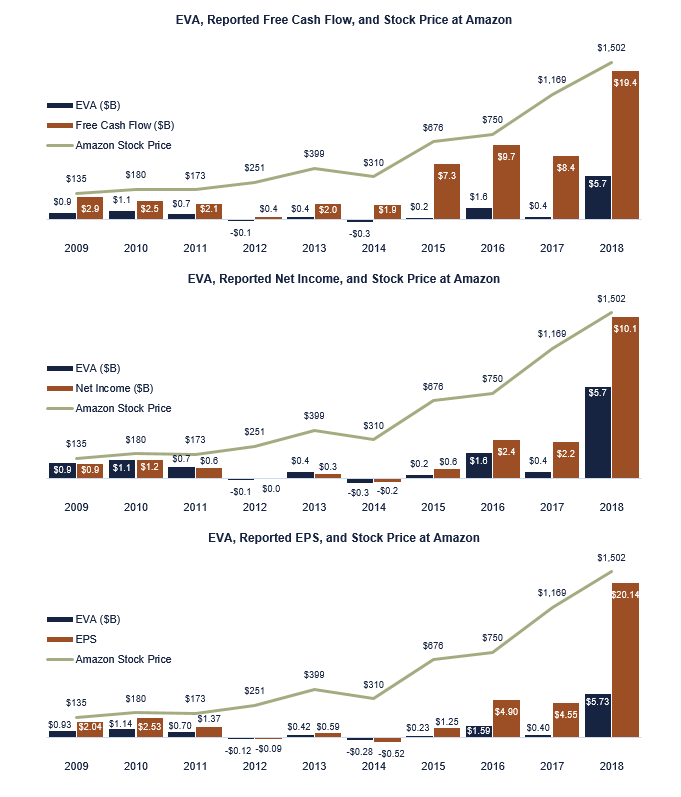
Exequity responded to several contentions in an earlier Client Briefing,[1] but to test EVA versus earnings release metrics (not just EBITDA), we analyzed Amazon.com, Inc., which ISS Senior Advisor Bennett Stewart suggests is “a very good example to illustrate why EVA is so superior to the other measures.”[2] Historically, Amazon has not used EVA. Rather, for more than 10 years, Amazon has cited operating cash flow first in its earnings releases. How do Amazon’s earnings release metrics compare to EVA?
We find Amazon’s reported earnings correlate better with stock price than EVA. Over a 10-year period, correlations between stock price and operating cash flow, net sales, operating income, net income, and EPS range from 0.86 to 0.97. To further test the validity of these measures, we performed a multiple regression to determine the combined explanatory power, finding a multiple correlation of 0.99. In plain English, this means that Amazon’s stock price closely tracks its reported earnings metrics. In stark contrast, EVA has a correlation of 0.28 with Amazon stock price.[3]
Companies commonly use earnings releases to communicate what they believe are their key value drivers. The implication is that investors should follow those measures closely. Given the diversity of business models, it is common for value drivers to differ between companies. At Amazon, operating cash flow and revenues are key, but for others, net income and return on invested capital (ROIC) may be most appropriate. If the Amazon example is any indication, compensation committees should feel comfortable in applying their own business judgement, rather than feeling the need to turn to ISS’s one-size-fits-all notion that EVA presides over all.
ENDNOTES
[1] In Exequity’s Client Briefing, ISS, EVA, and Economic Voodoo, we responded to contentions made by ISS about EVA presented in EVA, not EBITDA: A Better Measure of Investment Value. Our calculations did not find EVA to be “superior” to EBITDA.
[2] Source: The Link Between TSR and EVA, published by ISS on April 4, 2019. Metrics referenced include total revenue, EBITDA, EPS, return on capital, and free cash flow, among others.
[3] In the multiple regression, four of the five variables highlighted by Amazon are statistically significant at p < 0.01 (i.e., four are statistically very meaningful). When EVA is added to these five, p = 0.25 for the EVA variable and three of the five Amazon metrics are significant at p < 0.01 and one at p < 0.05.
This post comes to us from Exequity LLP. It is based on the firm’s memorandum, “Valuing Amazon—Using Its Financials,” dated October 23, 2019.