 Sky Blog


Following news reports about executives selling shares in their corporations to avoid losses due to the pandemic, we take a closer look at insider trades and find that net insider purchases have been positive in February and March, revealing corporate optimism, not pessimism. Our findings are a reminder that not all burning questions about the impact of the pandemic can or should be answered right now.
Accurate answers rely on good data, but good data are hard to come by. One reason is that we are measuring some things for the first time, such as the true death toll of the coronavirus. Another reason is that we simply do not have clean data yet.
Take the question of how corporations are responding to the pandemic. To understand how businesses are being affected and what types of businesses are doing better than others, we need accounting data and governance data for 2020.
These data typically come from annual reports. Companies with a December 31 fiscal year hold their annual meetings in the spring. They typically file their annual reports by the end of March, but in 2019, some 30 percent of the 7,000 reports were filed in April and later. While firms also publish quarterly data, most release comprehensive annual data only 90 days after their fiscal years end, so the earliest date that a large sample of data on firms will be available is April 2021.
To access and analyze company data, academics, journalists, and analysts rely on aggregators like Compustat, CRSP, Thomson Reuters, or Bloomberg. These aggregators typically do some cleaning before releasing the data, which introduces a further delay for the end user. For example, subscribers to the annual CRSP dataset, such as the University of Oxford and the University of New South Wales, will only be able to access 2020 stock price data in February 2021.
Without up-to-date data, we can only rely on history and incomplete pieces of information to make sense of what is happening now. Relying on history is important, but relying on incomplete data and anecdotes can be misleading.
An example illustrates this point. On March 24, 2020, the Wall Street Journal ran a story about executives selling shares in their corporations to avoid losses due to the pandemic. The article highlighted the poor optics involved when insiders sell their shares. If it is true that insiders are selling out, that should be considered extremely bad news, as it would signal that executives have little confidence in the recovery of the businesses they run.
The analysis underlying the Wall Street Journal article was seemingly impressive. The Journal analyzed 4,000 regulatory filings related to stock sales between February 1 and March 19 by corporate officers of companies traded in the U.S. However, the analysis was difficult to replicate because the latest available data on insider trades in the standard aggregator of insider trading data, Thomson Reuters Insider Data, are from June 2019.
We scraped all insider trading data from January 1, 2010 until April 17, 2020 directly from SEC’s EDGAR system. In our new study, we find a similar number of regulatory filings in the period between February 1 and March 19 as the Journal does. Our sample contains 3,826 filings by corporate officers. However, it also contains 1,908 filings by corporate directors, who are typically included in analyses of insider transactions. Moreover, in addition to sales transaction, our data contain purchase transactions, which the Journal did not analyze.
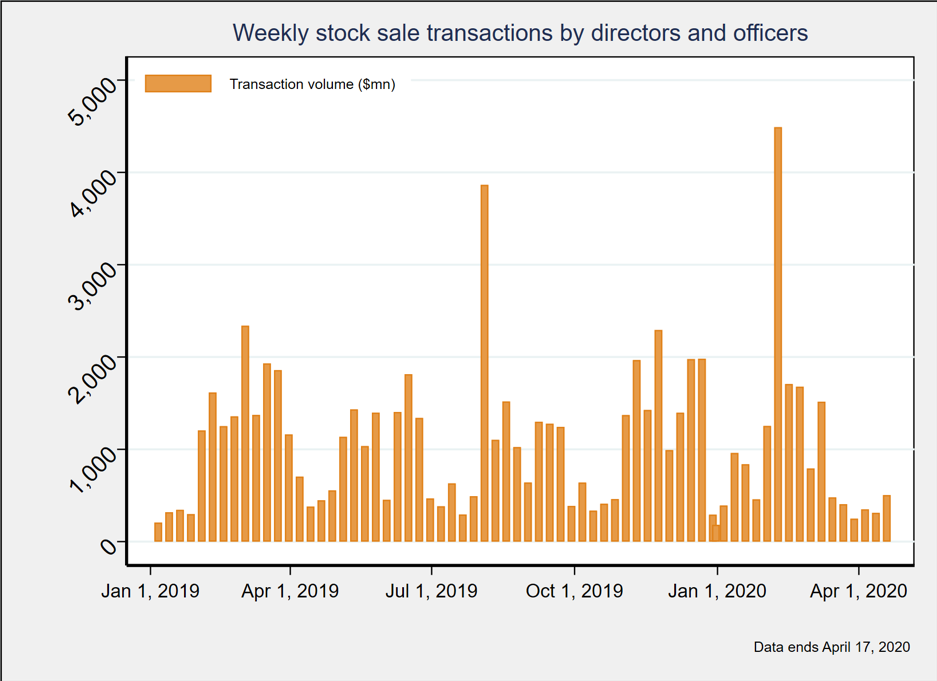
Figure 1 shows the total dollar value of sales by officers and directors for the period January 1, 2019 to April 17, 2020. Consistent with the Journal’s analysis, Figure 1 suggests that insider selling has been high in February and March of this year.
However, the figure also highlights that other periods experience spikes in sales, notably the fall of 2019, and that there appears to be some cyclicality to sales. For example, on average, insiders sell 25 percent fewer stocks on Fridays than on Mondays, and some 2-3 times as many sales transactions take place in March than in January.
Figure 1
To put the current period in perspective, we benchmark current sales transactions using data from January 1, 2010 to December 31, 2018. We regress the dollar value of daily sales transactions on day-of-the-week dummies and week-of-the-year dummies. The estimated model can be used to provide a prediction of “typical daily sales” during the period from January 1, 2019 and April 17, 2020.
In Figure 2, we plot “abnormal” weekly sales for this period, which are the differences between actual sales and “typical daily sales” aggregated to the weekly level. In contrast to the idea that insiders may be selling out, Figure 2 shows that selling has been abnormally low in the recent period. During the weeks ending March 15 and March 29, for example, share sales were $1.5 billion and $680 million lower than in the same weeks in the 2010-2018 period.
Figure 2
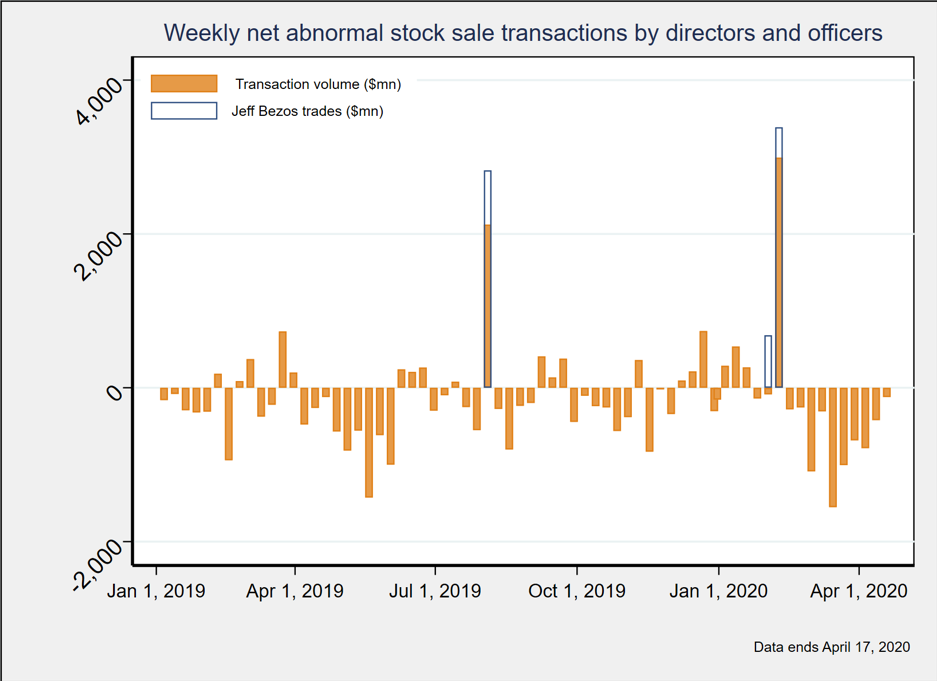
While there is a noticeable spike in sales in February, Figure 2 shows that this spike can be attributed to sales by Amazon founder and CEO Jeff Bezos. Once Bezos’ sales are accounted for, abnormal sales during that week are negative. Since Bezos executed a share sale of similar magnitude in August 2019, it is questionable that Bezos was trying to avoid losses with his 2020 sale.
Another way of examining insiders’ confidence in their companies is to examine purchase transactions, which the Journal article does not mention. The market reaction to an insider’s purchase of their company’s stock is typically positive, which means that purchases are a signal that executives have confidence in their companies.
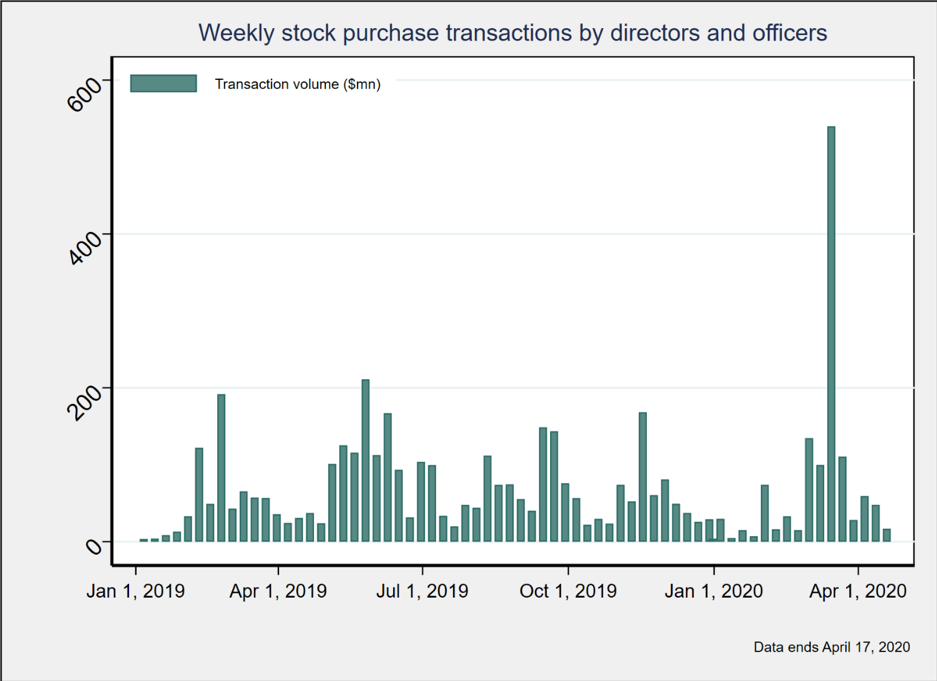
Figure 3 shows the total dollar value of purchases by officers and directors for the period between January 1, 2019 and April 17, 2020. Figure 3 does not suggest that insiders are reducing their stock purchases to avoid declines in value (by law, insiders must hold onto their shares for at least six months to avoid round-trip transactions). In fact, using the same method as for sales, we observe that the recent period is characterized by abnormally high purchases.
Figure 3
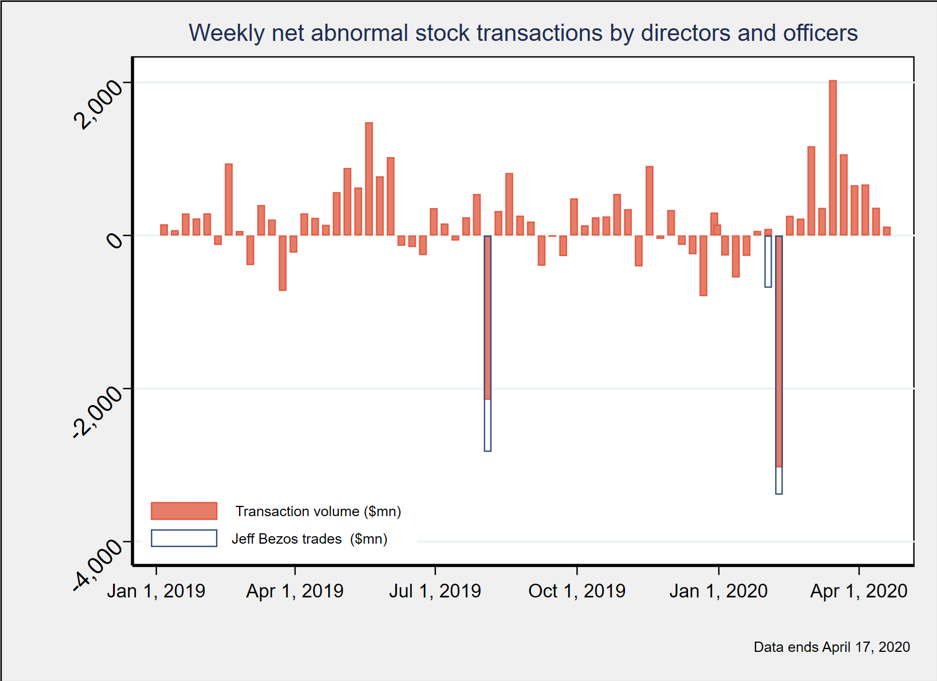
The net effect of insider sales and purchases is plotted in Figure 4. It shows weekly abnormal net purchases, defined as total purchases minus total sales. Instead of selling out, insiders bought more shares than they sold in recent weeks.
Figure 4
This example illustrates our point that having reliable and complete data is important for understanding current events.
Context is also important. Some actions during the pandemic will need to be taken based on limited information, but we should be careful to acknowledge the limitations of what we can and cannot say with certainty. Social distance should come with academic and professional distance.
This post comes to us from Professor Renée Adams at the University of Oxford and Attila Balogh, a PhD candidate at the University of New South Wales. It is based on their recent paper, “Insiders responding to the outside world: Business confidence during the pandemic in context.”