 Sky Blog
The economic consequences of the COVID-19 pandemic have upended countless budgets for 2020 and rendered long-term forecasts speculative at best. By now, most companies providing financial guidance have withdrawn it. Uncertainty abounds.
All the while, investors, proxy advisors, and other constituencies continue to demand pay-for-performance. Media and critics of executive compensation are culling through filings in search of companies taking actions that could be perceived as friendly to executives at the expense of stakeholders that may run counter to a strict pay-for-performance philosophy. Common modifications that may be taken in the current market to set more reasonable financial goals for long-term incentives (e.g., three consecutive one-year goals or use of discretion) risk being criticized by investors if outcomes do not surpass the goals set before the full impact of COVID-19 was apparent. In the absence of a reliable goal-setting process, compensation committees facing pressure to demonstrate pay-for-performance may increasingly turn to relative total shareholder return[1] (RTSR).
Before 2020, the use of RTSR as a performance metric was usually part of the conversation. Today, in part due to the difficulty to forecast reasonable financial goals, a discussion of long-term incentive metrics is remiss without consideration of RTSR. RTSR requires no goal setting, is simple to adopt, provides a defensible link to shareholder value, and has historically been accepted by shareholders and proxy advisors.
2020 Report Highlights
Prevalence of RTSR in long-term incentive plans increased 2% for 2020[2] to 60% of S&P 500 companies. Usage among companies in most industries increased slightly, and RTSR prevalence exceeds 40% for each S&P 500 sector for the first time. RTSR as a discrete metric is the most prevalent approach, used by 77% of companies, while 23% utilize RTSR as a modifier (an increase of 2% from 2019). Among companies employing RTSR as either a metric or modifier, 27% use a broad index group (e.g., the S&P 500) and 73% use a focused peer group. The S&P 500 is used by 23% of companies using RTSR.
Prevalence
Energy and Utilities companies continue to be the primary users of RTSR across the S&P 500, with 93% of Energy and 96% of Utilities companies using RTSR. Real Estate and Materials companies report high RTSR prevalence as well, 87% and 75%, respectively. Within each of these high-prevalence sectors, companies tend to face similar commodity price pressures or economic similarities, potentially rendering RTSR a more reliable method for identifying financial and operational outperformance via market performance. (We refer to Energy, Materials, Real Estate, and Utilities companies collectively as the “Core” group of RTSR users, and the remaining companies as “Non-Core.”)
We note that Non-Core RTSR companies use RTSR with less frequency than Core companies. Prevalence among other Non-Core companies is generally within the 40%–60% range.[3] We would posit that Non-Core companies experience a more diverse array of stock price pressures than do Core companies.
The table below reflects the prevalence of RTSR programs within selected industries.
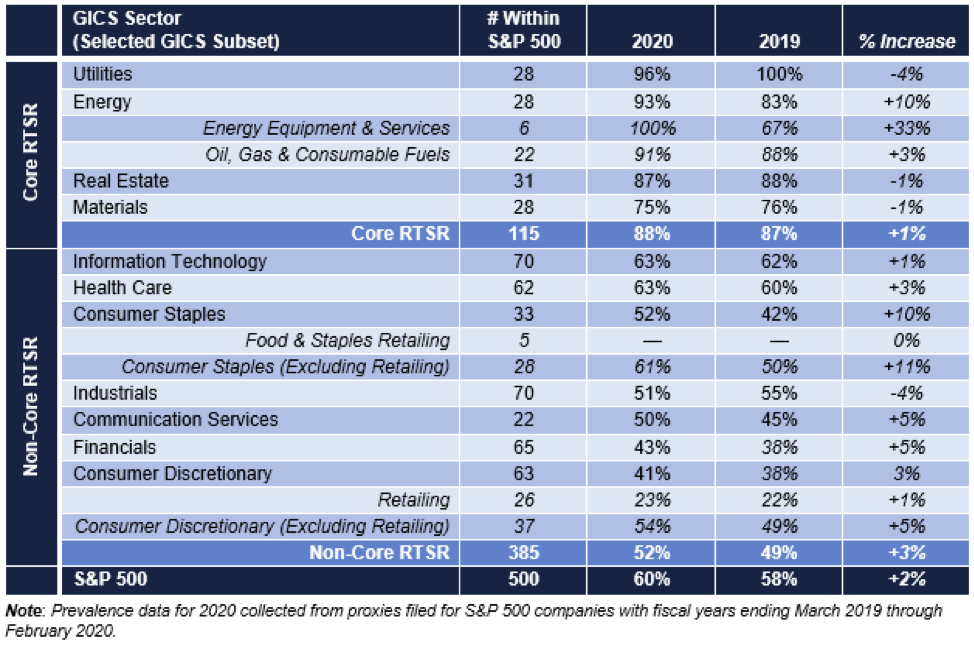 Note: Prevalence data for 2020 collected from proxies filed for S&P 500 companies with fiscal years ending March 2019 through February 2020.
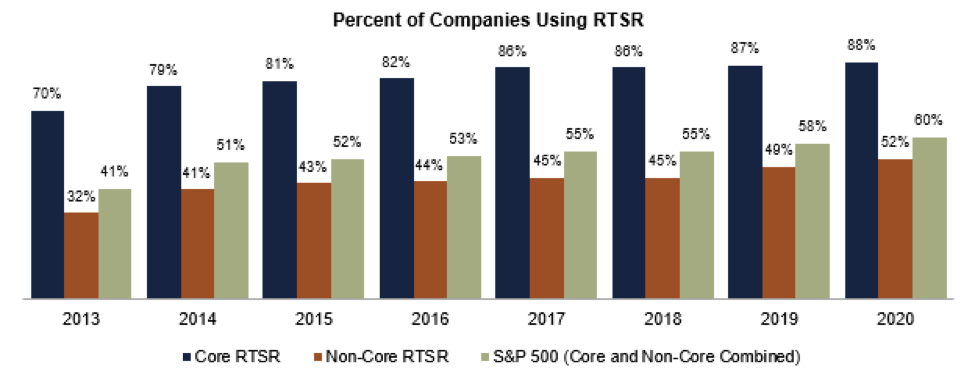
Overall, prevalence of RTSR programs for 2020 is 2% higher than in 2019 and 19% higher than in 2013.
Peer Group
The selection of an RTSR peer group is a critical factor in the establishment of an RTSR program. We separate peer groups used by companies for measuring RTSR into four categories:
- Multi-sector index—a broad-based index comprising multiple sectors such as the S&P 500 or two or more sectors within a broad-based index (e.g., S&P 500 excluding Financials).
- Single-sector index—a focused industry sector index (e.g., MSCI US REIT Index, S&P 500 Utilities).
- Custom compensation peer groups—the custom compensation benchmarking peers.
- Custom performance peers—a custom peer group used solely for performance comparisons.
Peer group selection across industries may reflect the ease—or difficulty—companies have with picking peer groups and the degree to which companies within certain sectors are comparable to each other. Across the S&P 500, 73% of companies use a focused peer group (industry index or custom group) and 27% use a multi-sector group such as the S&P 500. Overall, 55% use peer groups selected by third parties (i.e., an index, either broad or focused).
Core companies, especially Energy, REITs, and Utilities, routinely use focused peer groups (Materials companies are an exception, discussed further below). Within the Energy sector, 100% of Oil and Gas companies benchmark RTSR against custom groups. This is likely due to the differing impacts oil prices have on companies within various segments of the Energy sector. For example, a rise (or fall) in global oil prices will affect exploration and production companies differently than oil transportation companies or oil refining companies. No Energy company uses the S&P 500 as its RTSR group, but a small number are adding the S&P 500 Index Composite as a performance peer.
In contrast, 52% of Utilities benchmark to a sector index group (e.g., Philadelphia Utility Index). Utilities generally are more comparable to each other within the sector than are Energy companies, though 30% use a custom performance group, possibly in recognition of differences in business models such as regulated versus non-regulated asset mix. Two Utilities use the S&P 500 Index for secondary comparisons (e.g., 25% weighting). Nearly one-half of REITs use multiple RTSR peer groups and 15% use a broad index, often alongside a focused peer group.
Peer group usage among Materials companies is somewhat different than other Core companies. Materials companies often have significant challenges setting three-year financial goals due to the impact of commodity prices (or other outside forces), not unlike how Energy companies are impacted by the price of oil. The key difference with Materials versus Energy is the diversity of exogenous factors: Materials companies range from chemicals to paper to metals and mining companies, all serving myriad consumers and companies. This creates a significant challenge for identifying peers. There is a split in how Materials companies employ RTSR to address this challenge—most use highly focused custom peer groups (52%), while many others use a broad index such as the S&P 500 (38%). The inherent dissimilarities among Materials companies are likely why just one S&P 500 Materials company benchmarks to the S&P 500 Materials Index companies (one other company benchmarks to the S&P 500 Chemicals Index).
Non-Core companies are more likely to use broad indices, especially Information Technology and Communication Services (59% and 45%, respectively). Half of Information Technology companies use the S&P 500, and 9% other broad indices. Within Communication Services (which includes traditional media and telecom, as well as social media), just 9% use the S&P 500 and 36% other indices (or selected S&P 500 sectors). Industrials and Financials are more likely to use custom performance peer groups, possibly due to their ability to confidently pick companies with similar business models (and higher stock price correlations) than other Non‑Core companies. Consumer Staples favor custom compensation peers more than any other sector and rarely use the S&P 500, unlike other Non-Core companies.
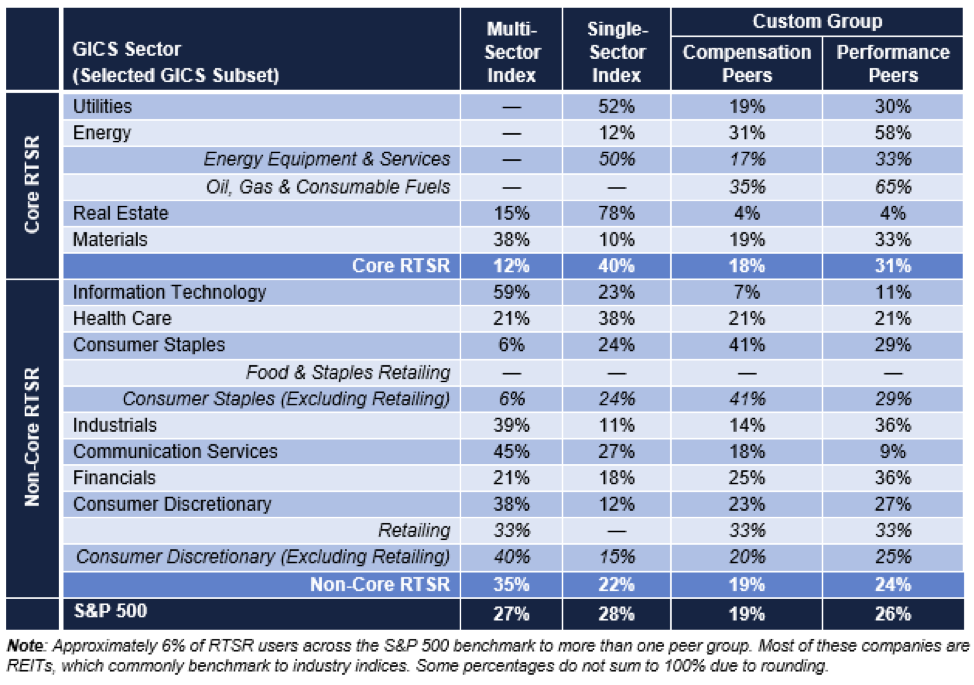 Note: Approximately 6% of RTSR users across the S&P 500 benchmark to more than one peer group. Most of these companies are REITs, which commonly benchmark to industry indices. Some percentages do not sum to 100% due to rounding.
RTSR Plan Design
RTSR as a Metric Versus Modifier
Most companies employ RTSR as a discrete metric within a performance plan (77% of S&P 500 companies), while the remainder (23%) apply RTSR as a performance modifier.
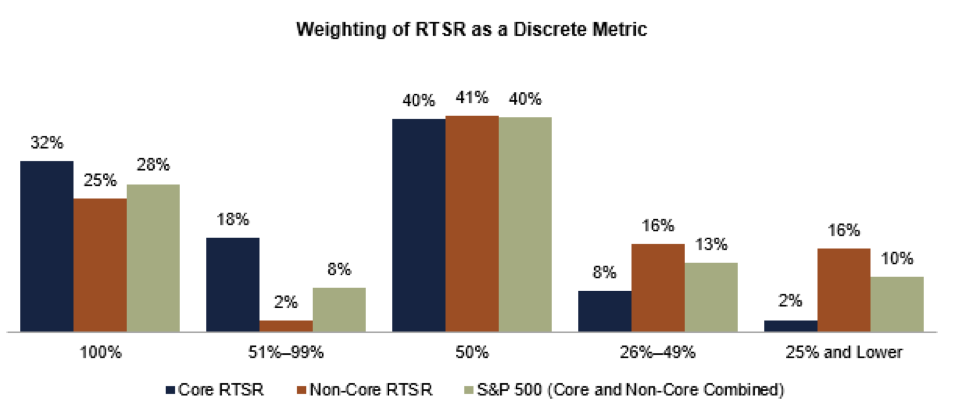
RTSR as a Discrete Metric
Used as a discrete metric, RTSR is assigned a weighting within the performance share plan (e.g., 50% RTSR and 50% return on capital). The most common RTSR weight for a discrete metric is 50% for both Core and Non-Core companies. This is a notable change from 2019, when the most common RTSR weight among Core companies was 100%. Nonetheless, Core companies continue to place slightly greater weight on RTSR in performance plans than Non-Core companies, with 32% of Core companies using RTSR as the only performance measure versus 25% of Non-Core companies. In 2019, 40% of Core companies used RTSR as the sole performance metric and 34% weighted it 50%. The graph below presents RTSR weightings as a percentage of total performance shares across Core and Non-Core companies.
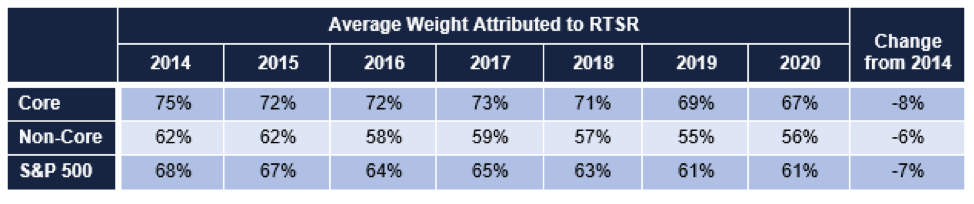
Since 2014, the average weight given to RTSR as a metric has been slowly decreasing, a trend for both Core and Non-Core companies. The table below displays the average weight attributed to RTSR (excluding RTSR modifiers).
RTSR as a Modifier
As a modifier, RTSR generally adjusts the primary performance plan earned values, which typically measure a non-market metric (e.g., return on capital). In most cases, RTSR modifiers provide for two-way (upward or downward) adjustments to plan payouts (e.g., a modifier of +/-25%), though some companies use one-way (downward or upward) modifiers. Of the companies using RTSR as a modifier, 83% use the two-way method and 17% use one-way modifiers. Use as a modifier is more common among Non-Core companies (29%) than Core companies (11%).
Modifiers may be applied in additive or multiplicative manners. An additive modifier adds or subtracts from pre-modifier performance share payouts (e.g., financial performance payout plus 25% for outperformance). A multiplicative modifier uses a performance factor which is multiplied by pre-modifier performance share payouts (e.g., financial performance payout multiplied by a factor of 1.25, or 125% for outperformance). Among S&P 500 companies using a two-way modifier, 54% use a multiplicative method and 46% use an additive method.
The table below provides examples of common performance plan determinations under the two methods.
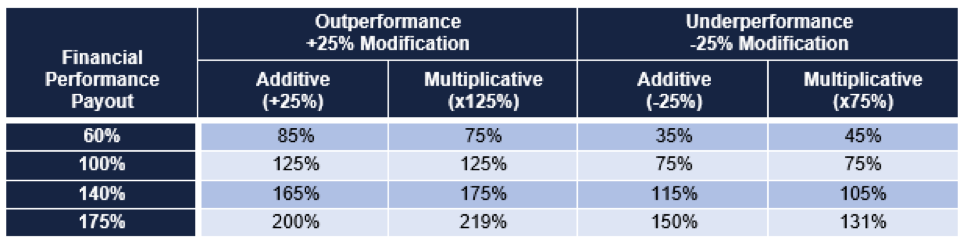
Most companies using RTSR modifiers do not disclose imposing a cap on payouts at the plan maximum. For example, if financial performance pays out at 200% of target, then a modifier could increase the payout to above 200%. Eleven percent disclose capping the maximum payout at the plan maximum.
Companies using one-way modifiers tend to apply them as punitive measures for failing to achieve a threshold RTSR performance level, which may reduce (or cap) financial performance payouts. A small number of companies include upward modifiers to reward outperformance.
RTSR Performance Measurement
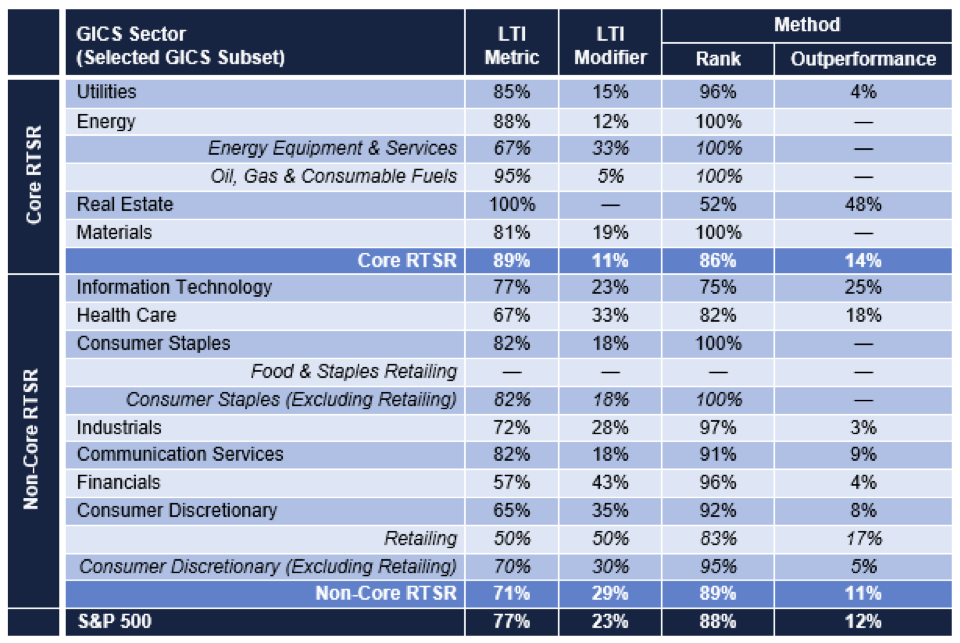
Performance measurement methodology is varied across S&P 500 companies. Most companies (89%) with RTSR plans use percentile rank or numerical rank methods for benchmarking relative performance. Among these companies, 86% use the percentile rank method, and 14% a numerical rank method. Of those using the numerical rank method, roughly 50% are Energy companies.
An alternative to the traditional ranking method is to measure the spread in TSR relative to a defined barometer of performance, such as an index composite or the median TSR of a peer group[4] (sometimes referred to as an “outperformance” method). This method is used by 12% of S&P 500 companies, but is most common among REITs, with roughly 43% measuring RTSR against an index composite figure or peer group median. This method is less than 10% prevalent across non-REIT S&P 500 companies.
The table below identifies the ways in which RTSR is used within selected industries.
Other Design Elements
Pay/Performance Leverage
Unlike other design elements of RTSR plans, pay/performance leverage varies less across industries.

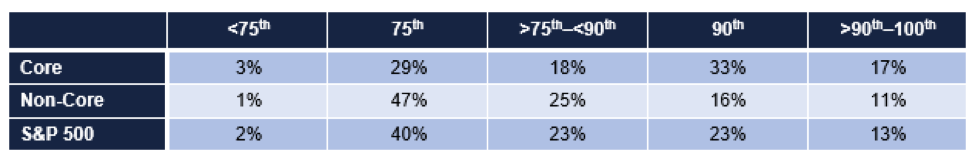
Note: When RTSR is used as a modifier, the most common performance hurdles are 25th and 75th percentiles (threshold and maximum, respectively), and the median/mode percentage modifier is +/- 25%. Data displayed in the above table excludes performance ranges for companies using RTSR as a modifier.
While the single most common maximum performance percentile remains at the 75th, it is a majority practice for companies to require performance to exceed this level. Nearly 60% of all S&P 500 companies require performance above the 75th percentile for RTSR plans to pay at maximum. Core companies tend to require higher performance levels for a maximum payout than Non-Core companies, with 68% of Core companies requiring performance exceeding the 75th percentile, versus 52% for Non-Core companies. The general trend is towards increased performance requirements, with companies requiring higher performance levels to achieve a maximum payout. The table on the next page displays maximum performance percentiles required to achieve maximum payouts.
Above-Median Target Performance Percentile
The standard performance target in RTSR plans is the peer group median. However, an increasing number of companies are targeting levels above the median. The reasons companies do so may be tied to trying to guard against proxy advisor criticism of pay plans or seeking to demonstrate more strenuous pay-for-performance requirements. Proxy advisors, especially ISS, are scrutinizing RTSR plans and occasionally criticizing companies for prescribing a target-level payout at median performance. Nonetheless, despite this ISS criticism, 89% of S&P 500 companies target the peer group median for their awards granted annually and 11% target above the median (the same prevalence as Exequity reported in 2018; 2019 prevalence was 9%). Among those targeting above the median, 25% target the 60th percentile, 66% the 55th percentile, two companies between the 55th and 60th percentiles, and one company the 75th percentile.
Negative TSR Cap
Some companies impose a “cap” on RTSR payouts when absolute TSR is negative. Prior to the COVID‑19 pandemic, some compensation committees were already uncomfortable with the possibility of above‑target RTSR payouts when shareholder returns over the measurement period are negative. With negative returns in several hard-hit industries, media and other interested observers are beginning to focus more on RTSR plans and whether companies are employing this feature. Proxy advisors favor capping awards at target when absolute TSR is negative.
Currently, 26% of S&P 500 companies disclose caps on RTSR awards. Despite the attention negative TSR caps have received, prevalence increased just 6% from 2017 and 1% since 2019. Slightly more Core companies use negative TSR caps than Non-Core companies (29% and 24%, respectively). More Energy companies employ RTSR caps (42%) than any other sector.
When absolute TSR is negative, the method most companies use to cap payouts is to set the maximum payout at 100% of target. A small number of companies use other methods, including negative modifiers or even alternative pay-for-performance scales. To date, proxy advisors seem to prefer caps that disallow above-target payouts when absolute TSR is negative.
Multiple Performance Periods
A feature not often discussed in RTSR awards is the use of multiple performance periods. In this construct, a single RTSR grant is divided into multiple performance periods. The most common is a structure where there are three discrete periods of one, two, and three years. Just 5% of companies using RTSR use multiple performance periods, but about one-half of the companies using this construct weight RTSR at 100%. Using multiple performance periods is a way of mitigating the risk of no payout in a given three-year RTSR performance cycle.
Stock Price Averaging
Companies commonly use stock price averaging periods to smooth out daily volatility at the beginning and end of the performance period. Among companies disclosing averaging periods, approximately 66% use a period of one week to one month (with 20 trading or 30 calendar days being the most prevalent periods), 20% use a period of five to ten weeks, and 14% use 90 calendar days or longer.
Decision Points for Companies Considering RTSR
Companies considering RTSR for the first time, or making changes to an existing plan, should give thought to the key attributes of RTSR plans to avoid last-minute decisions or confusion when performance is assessed. A summary of key decision points is presented below.
- Peer group. What is the compensation committee’s philosophy with respect to performance measurement?
- Some believe comparisons to the broader capital markets are appropriate (e.g., S&P 500).
- Others seek to reward for outperformance of only those companies most like the sponsor (e.g., focused groups such as custom compensation peers, performance peers, sector indices).
- Metric versus modifier. Will RTSR be used as a discrete performance metric, or will it modify financial/strategic performance conditions?
- Should an additive or multiplicative modifier be used? What should the maximum payout be?
- Performance assessment. Should performance be assessed using a ranking method or outperformance method?
- If a rank method, then numerical rank or percentile rank?
- If outperformance, then versus an index composite or peer median?
- Performance requirements. What levels of relative performance (or outperformance) should define threshold, target, maximum performance? What are the payouts for these performance levels?
- Should target performance be set at the median? Or a higher level, such as the 55th percentile?
- Performance cycle. Should performance be measured in three-year increments? Or a combination of periods?
- If a company operates in a highly cyclical industry and business cycles do not align with the standard three-year periods, should multiple performance periods be used to reward for performance across cycles?
- Averaging period. Should performance be measured based on the first and last trading days of the performance cycle, or an average trading price at both ends? The emerging standard is roughly one month, though longer (or shorter) averaging periods may be reasonable.
- Negative TSR cap. Should payouts be capped at target if absolute TSR is negative?
- Proxy advisors sometimes criticize companies without negative TSR caps.
S&P 500 RTSR Prevalence and Design Results Detail
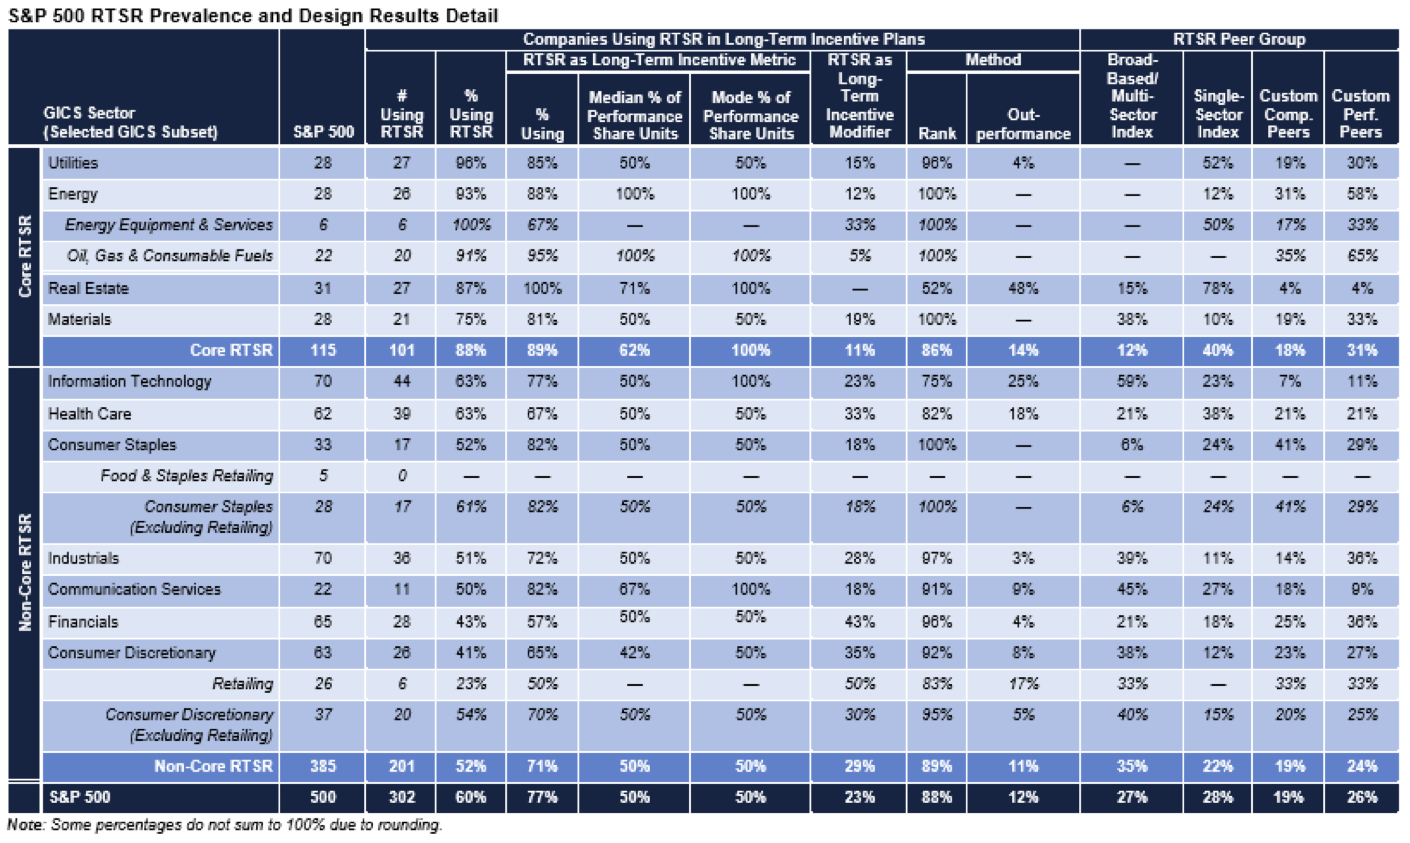 Note: Some percentages do not sum to 100% due to rounding.
ENDNOTES
[1] Total shareholder return is defined as the change in stock price plus reinvested dividends.
[2] S&P 500 companies with fiscal years ending March 2019 through February 2020.
[3] In prior years, this range was 40%–50%, but prevalence has increased across several sectors.
[4] A company employing this method compares its TSR to that of the index composite figure and adjusts payouts based on the spread between the two figures. For example, if the company’s TSR is 15% and the index composite TSR is 5%, then the company beat the index by 10 percentage points. Assuming a payout of 2% of each percentile of outperformance, this would yield a 110% payout.
This post comes to us from board and management adviser Exequity. It is based on the firm’s memorandum, “2020 Relative TSR Prevalence and Design of S&P 500 Companies,” dated July 14, 2020.