With some exceptions, 2021 was a generally strong year for equity markets around the world. Impressively, passive ESG products such as ETFs garnered significant inflows of over $150 billion dollars and saw asset under management growth of over 80% globally. In 2021, ISS ESG marked the one-year anniversary of our initial proprietary index launches, the ISS ESG US Diversity Index and the Governance QualityScore (QGS) Index family. We also launched our ISS ESG EVA Leaders Index family, an innovative index approach combining corporate sustainability with economic profitability.
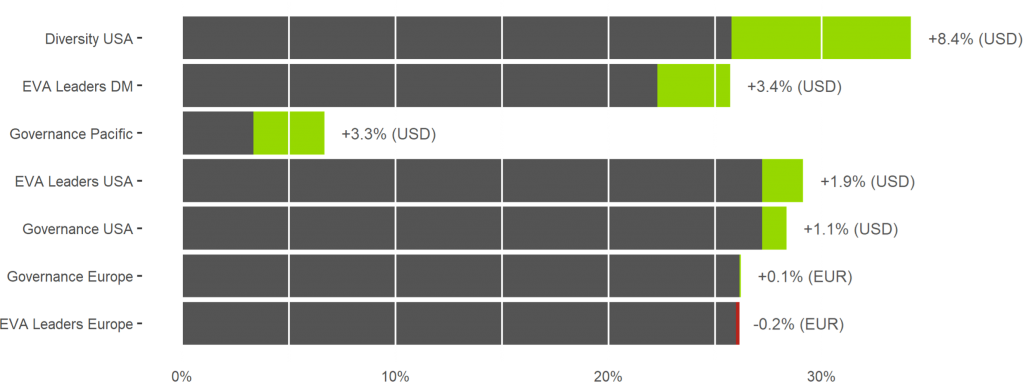
In this note we provide a short summary of the total return performance of these ESG indices in 2021. Notably, of the seven live indices which currently make up the ISS ESG Index family, six observed greater or equal returns than their parent universe last year, some quite significantly. Furthermore, the lag of the lone underperformer was only 0.2%.
ISS ESG indices total return and performance compared with respective parent universe

Source: ISS ESG. Past performance may not be indicative of future returns.
What does this mean for ESG in 2022? While we don’t know what the future will hold, the potential for investors and asset owners to increase their allocations to rules-based ESG approaches appears well supported by the still relatively low market share of ESG products within the overall ETF universe. The ESG transition may still be in its early days and spur further innovation in both data and products.
ISS ESG US Diversity Index
Total return and performance compared with parent universe

Source: ISS ESG. Past performance may not be indicative of future returns.
The ISS ESG US Diversity Index (ISSDIVUT) had the largest excess return within the ISS ESG Index Family, besting the 2021 return of its benchmark Solactive GBS US Investable Universe by 8.4%. The index is constituted of US companies that exhibit broad ethnic and gender representation among directors and Named Executive Officers (NEO). The strong relative performance supports the growing body of evidence that gender and ethnic diversity is associated with financial success.
ISS ESG EVA Leaders Index Series
Total return and performance compared with respective parent universe

Source: ISS ESG. Past performance may not be indicative of future returns.
The ISS ESG EVA Leaders indices implement an innovative ESG+F (financial materiality) approach to select issuers that achieve both economic profitability and high ESG performance. While the index family was formally launched in September 2021, returns for the full year show that two out of three of the regional indices strongly outperformed their benchmarks. The ISS ESG Developed Markets EVA Leaders Index (ISSEVADT) was the most notable outperformer, recording a 3.4% higher return than its Solactive GBS benchmark.
ISS ESG Governance QualityScore Index Series
Total return and performance compared with respective parent universe

Source: ISS ESG. Past performance may not be indicative of future returns.
The ISS ESG Governance QualityScore Index (GQS) series provides investors with the opportunity to align portfolios with companies that excel at managing governance risks across four key areas: Board Structure; Compensation; Shareholder Rights; and Audit & Risk Oversight. In 2021 this approach proved the most fruitful in the Pacific ex-Japan region, as governance issues rose to the fore. The Pacific Ex-Japan GQS (ISSGQSPT) and US (ISSGQSUT) indices outperformed their benchmark by 3.3% and 1.1%, respectively, while the Europe GQS (ISSGQSET) performed in line with its parent universe.
This post comes to us from Institutional Shareholder Services. It is based on the firm’s article, “ISS ESG Equity Indices: 2021 Year in Review,” dated January 19, 2022, and available here.
 Sky Blog