 Sky Blog
The good management of long-term ESG risks may aid in the reduction of financial risks as companies hedge against negative impacts from, for example, natural disasters, volatile energy prices, or labor-related controversies.
The ESGF Rating provides additional insight into companies’ financial quality as viewed through the ISS EVA lens alongside their assessed ESG performance. It thereby serves as a data point that helps determine which companies have both strong levels of risk-adjusted profitability as well as a positive ESG profile.
Methodology
Data and research from the ISS ESG Corporate Rating and the ISS Economic Value Added (EVA) framework are leveraged to calculate the ESGF Rating. The overall assessment, as well as all underlying data points, are graded on a twelve-point scale from A+ (very good performance) to D- (poor performance). The letter grades correspond to numeric scores ranging from 1.0 (D-) to 4.0 (A+) in 0.25 increments.
The ISS ESG Corporate Rating captures and evaluates companies’ management of ESG risks, opportunities, and impacts along the entire value chain, including a detailed assessment of impacts from products and services, as well as their involvement in controversial practices. Applying an industry-specific materiality approach, each issuer is evaluated on approximately 100 indicators. This allows for highly relevant, material, and forward-looking ESG performance assessments.
The ISS ESG Financial Rating leverages data from ISS EVA, an established standard in measuring, analyzing, projecting, valuing, and discounting a firm’s underlying economic profit rather than its accounting profit. Like the ISS ESG Financial QualityScore (FQS), the Financial Rating is based on EVA Profitability (P) and Risk (R) measures. The difference is that FQS is based on the industry-relative performance, while the Financial Rating is an absolute assessment. The Profitability factor consists of EVA Profitability Level (P1) metrics along with EVA Profitability Trends (P2) measured over the last quarter, year, and three years. The Risk factor is calculated based on the Volatility (R1) of EVA Profitability and the three-year standard deviation of the stock price. The second Risk component, Vulnerability (R2), evaluates free cash flow generation and balance sheet leverage. Figure 1 below has example scores to show the calculations that constitute the Financial Rating score.
Figure 1: Financial Rating Factors
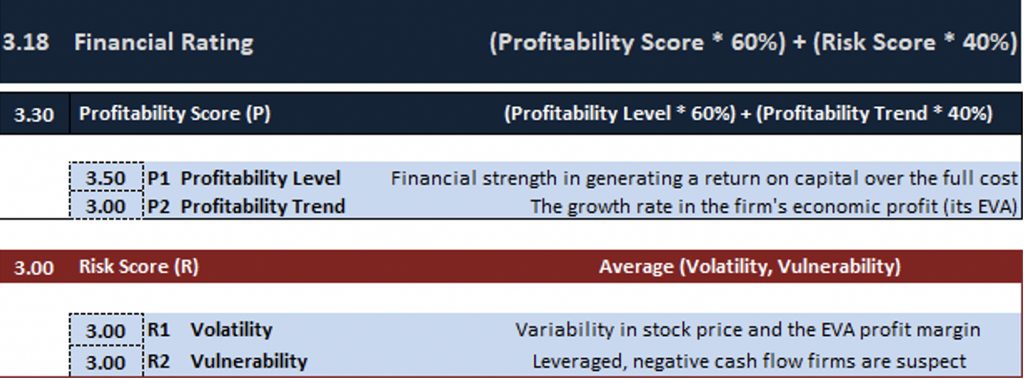
Source: ISS ESG/EVA
While the Financial Rating can be used as a standalone measure of a firm’s risk-adjusted profitability (quality), to understand the full view of quality, the combined ESGF rating is used. The ESGF model (Figure 2) is structured to make sure that poor ESG performance cannot be overly compensated by good financial performance. This is achieved using a weight distribution of 2:1 between ESG and F. In practical terms, companies with poor ESG performance (D ratings) cannot obtain a good or very good ESGF performance rating (A or B rating).
Figure 2: Results of the ESGF Model
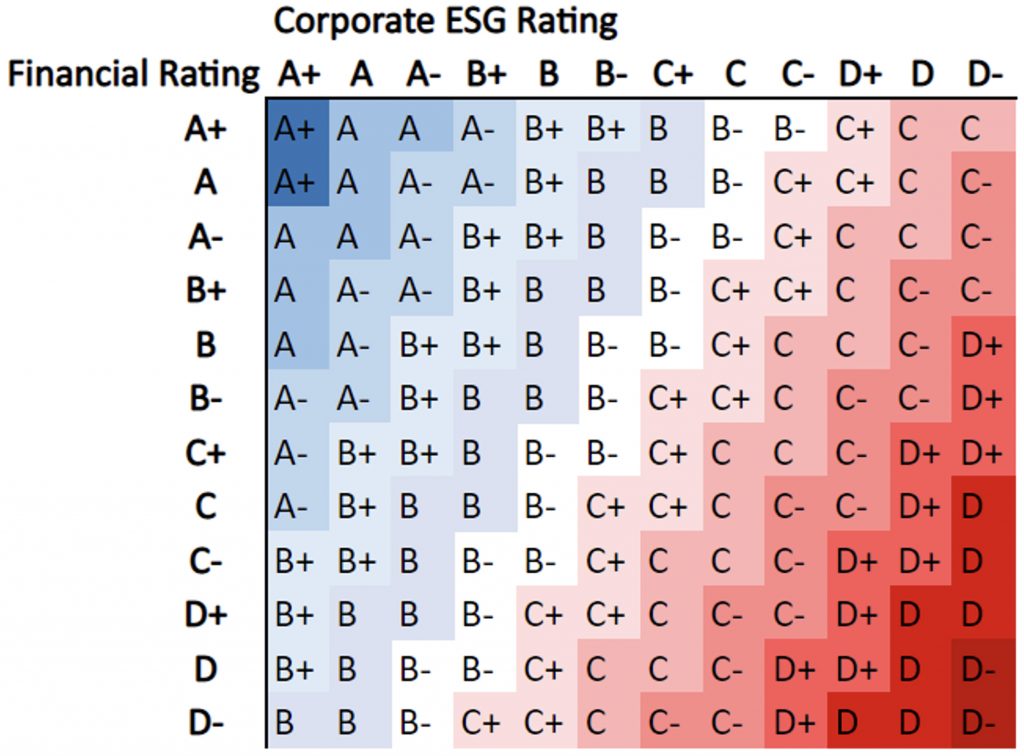
Source: ISS ESG/EVA
Correlations
The criteria to get into the top ranking of ESGF is strict. On the ESG side, only about 5% of the universe of companies score in the top two letter grades (A and B). The Financial Rating criteria are not quite as restrictive, with 39% of the companies scoring in the top two letter grades.
Additionally, it is worth examining where the companies with A&B ESGF Ratings ‘came from.’ The table below (Table 1) shows the breakdown of where the top two buckets of ESGF have come from on the ESG and F rating sides. For example, 164 of the 347 companies that score A or B in the universe were already scoring an A or B from an ISS ESG rating perspective. Looking at the Financial Rating shows 286 names scored in the top two grades (A or B) that continue to be ranked A or B in the ESGF methodology. As noted above, none of the companies in the ESGF A and B bucket receive the lowest grade of ‘D’ for ESG. Only five companies with a ‘D’ letter grade for Financial Rating make it into the top tiers. Data is from September 30, 2022.
Table 1: ESG & FR Constituent Breakdown
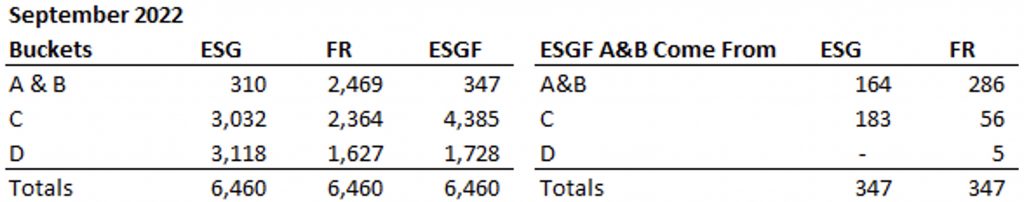
Source: ISS ESG/EVA
Conclusion
The ESGF Rating is a valuable and relevant addition to the Corporate Rating as it can help provide a fuller picture of a company’s overall operating performance and can thus support the determination of where on the quality curve a firm lives. Building on ISS ESG’s corporate rating and EVA methodologies and research, the ESGF Rating makes available financial data in an easily accessible format using a 12-point rating scale from A+ (best) to D- (worst).
This post comes to us from Institutional Shareholder Services. It is based on the firm’s article, “ESGF Rating: A More Complete Picture of Investing in Quality,” dated December 2, 2022, and available here.